Are U.S. Managers Superstitious about Market Share?
Superstition has always had a big impact on human behavior, sometimes yielding macroeconomic effects for even the most industrialized societies. An example of the effects of superstition is the rate of Japanese births from 1960 to 1990 (see Figure 1). A general, steady decline is evident in recent decades. But what jumps out is the single-year 25 percent drop in 1966. Such a sudden dip and recovery in birthrates meant all kinds of problems for companies selling baby cribs in 1966 or bicycles in 1972, for colleges and universities in 1984, and for employers in 1988.
Why did the market plunge 25 percent for only one year? In much of Asia (where Chinese influences are strong), each year is associated with one of twelve animals. For example, 1996 is the year of the Rat. Both 1990 and 1978 were years of the Horse, as was 1966. In Japanese culture, there is a traditional belief about heigo, or the year of the Fire Horse, which occurs once every sixty years, the last in 1966. According to this long-standing superstition, a female born in a year of the Fire Horse is destined both to live an unhappy life and to kill her husband if she marries.1 Judging by the birthrate that year in Japan, superstitions about the year of the Fire Horse deterred people from having children. The relevant point here is that superstitions can substantially affect behavior on a macroeconomic scale in industrialized countries.
Many U.S. managers are superstitious as well, particularly about business strategy. The false notion that higher market share causes higher profits has had a huge impact on companies’ performance, the associated welfare of employees and shareholders, and society in general. Unfortunately, corporate goals and executive incentive systems are often partially based on market share achievements. Business journalists evaluate companies by describing them in terms of market share, with the clear implication that bigger is better.2 And, every semester, marketing and strategy textbooks lead business students astray.3
The False Link between Market Share and Profitability
Recently, criticism has swelled against the presumed causal relationship between a business’s market share and its profitability. Critics question the extent, and perhaps the existence, of this traditional tenet of strategic management thought. Some researchers have presented evidence that companies with small market share can experience relatively high rates of return.4 Others have proposed that the relationship between market share and returns is indirect at best, because both are jointly determined by other factors, such as product quality, marketing-related expenditures, industry or product life cycles, relative prices charged, management quality, or even luck or fate.5 Still other researchers have proposed that any causal relationship is actually the opposite of the traditional view — that profits drive market share, not vice versa.6 At the very least, these researchers suggest, the relationship is two way.
These numerous exceptions to the traditional market share rule have led some investigators to conclude that market share is not valuable as an end unto itself. In fact, Robert Jacobson and David Aaker, writing in the economic boom year of 1985, suggested that a “decline in market share may actually be an indication of good management.”7 Kevin Clancy and Robert Shulman completely missed this last possibility. In their criticism of the market share-profitability link, they state: “Today, planners are not so sure about anything concerning market share and profitability. There is no disagreement that it is positive, but there is plenty of debate concerning the magnitude of the relationship and what it means.”8
However, our studies lead us to agree with the apparent paradox that Jacobson and Aaker identify. Under a boom-bust scenario, maintaining market share can actually hurt, not help, profits. We have found that, in volatile environments, stability of operations is a better near-term corporate goal than chasing markets (and shares) up and down the boom-bust cycle. As the market is growing, firms seeking stability in sales may grow more slowly than other firms, causing an actual loss in market share. During the bust, however, the stable firms’ profits strengthen, leaving them in a better position to compete during the next cycle.
The boom-bust element of this analysis is crucial. Researchers have written much about firms in growing industries and in declining industries, particularly as industry structures change. However, they have paid little attention to firms in volatile environments that both rise and fall in a short time. Indeed, the standard competitive model of equilibrium that economists use assumes that demand is stationary, which is surprising in light of the fact that business cycles are common to most industries. In our study, unlike many previous ones, we take a multiyear perspective of performance.
Business cycles, what we refer to as demand volatility or discontinuity, can have several causes, for example, changes in customer preferences, regulation, technology, competition, and the relative prices of finished goods. Particularly in high fixed-cost industries, interrupted demand means idling expensive capacity and capital. It means laying off workers and managers (a variable cost by U.S. standards) and the ripple effects of strained labor relations and lower productivity due to hurt morale. Such turmoil inside a firm can affect the product flow to market. The very benefits a demand boom were thought to bring to the firm can be quickly wiped out by a demand bust. Indeed, managers caught in a down cycle must act to survive and succeed in the post-shock environment. Demand discontinuities can result in a redistribution of sales and profits across entire industries, because some managers are more adept than others at shifting strategy to match the competition in the new environment. Similarly, these distributions may change again after the next shock — and bust — occurs.
Stable Flexibility
Some researchers have found that, in response to volatile demand, flexibility of business operations can help smooth out the wild ride of discontinuity. For example, many studies point to general business strategies such as diversification, countercyclical advertising expenditures, and flexible pricing strategies as methods to stabilize sales and achieve stable, rather than erratic, growth over time.9
Specifically, in operations management, firms might try varying production rates, adjusting the part-time work force, and smoothing inventory flow through a just-in-time approach to dampen the effects of volatility. These might beaided by demand shifting, which can be accomplished by changing the mix of marketing variables such as pricing, advertising and other selling expenditures, and product lines and options. In other words, the term “market share” implies that manipulating marketing levers can affect the share a company captures. It follows that share is a function of all expenditures and activities required to bring a product to market, including production, promotion, and distribution.
Several prominent economists also advocate stability through flexibility. Businesses that will likely survive boom-bust cycles, they claim, are those that have flexible cost structures. In terms of U-shaped cost curves, the economists conclude that flexible businesses have gently sloping, flat-bottomed average cost curves and flat or gently rising marginal costs. In contrast, inflexible firms have steep, V-shaped cost curves and sharply rising marginal costs. Although these curves typically focus on production costs, a broader definition for the general manager would appropriately include all costs, including marketing, of bringing a product from the designer to the end user.
Despite arguments favoring flexibility, most U.S. managers tend to ignore stability and cling stubbornly to the market share dogma. The typical U.S. manager’s mandate from shareholders is to maximize quarterly profits and share price, which fit conveniently but mistakenly into the market share worldview. This may actually throw gasoline on the fire, exacerbating demand volatility rather than helping to quell it.
Not all companies, however, are so shortsighted. For example, when commenting on Ford Motors’ policy of not expanding plant capacity to meet increased demand in the late 1980s, Ford’s chairman Donald Petersen remarked: “We decided years ago to live with some shortage of our ability to get our full share in a peak year.”10 In our own interview with Petersen, he added, “During the auto market recovery in the latter part of the eighties, it was a struggle not to chase the market up. For example, the union leadership wanted us to hire more employees. But, when I talked with our hourly workers, they told me they like the added income and didn’t mind the overtime.Yes, we gave up some market share during the boom, but I believe both our work force and our shareholders benefited from our stability-oriented strategy.” Clearly, some of this wisdom is behind Ford’s subsequent performance. In the global 1992 recession, its loss was less as a percentage of sales and assets than the losses of either GM or Chrysler. Also, in 1993, five of the ten top-selling vehicles in the United States were Ford products, including the number-one seller, Taurus. In 1994, the profits at Ford continued stronger than ever.
The Japanese Example — A Yen for Stability
At this writing, the Japanese economy seems to be recovering from its uncharacteristic stumble in the early 1990s. Stock prices are up (some 42 percent over the 1995 lows), auto sales increased 4.8 percent in 1995, and Japanese executives are again beginning to travel first-class across the Pacific.11
Japanese businesses function more like families than vehicles for shareholder wealth, in that management takes responsibility for the welfare of the work force and eschews layoffs. Unlike the traditional U.S. view,12 labor in Japan is considered a fixed cost. Japanese firms cut prices to stimulate demand during market downturns in order to keep production stable and avoid hiring or firing workers. For example, a midsize Japanese construction company manager who was facing tough times in the Japanese recession a few years ago remarked, “We employ 2,500 workers. That’s not just 2,500 people. With their spouses, children, and dependent elders, that’s probably about 10,000 people. Our company must and will consider the welfare of all of those people in plotting its strategy to cope with the recession.”
In operations management, the Japanese kanban approach (just-in-time manufacturing) requires, among other things, a stable production schedule.13 An anecdote from Akio Morita, founder of Sony Corporation, illustrates this emphasis on the traditional Japanese strategy of stabilizing operations and long-term growth.14 In Sony’s early days, he quoted a higher unit price to a U.S. client for 100,000 transistor radios than the unit price for only 10,000 units. The American responded, “Mr. Morita, I have been working as a purchasing agent for nearly thirty years, and you are the first person who has ever come in here and told me that the more I buy, the higher the unit price will be. It’s illogical.” Yet, given the value a Japanese executive places on stable operations, the offer was completely logical. The production of 100,000 units would have required hiring new people, large outlays for capital equipment, and other measures that would have destabilized operations, particularly after the order had been filled. The customer would have had to pay a premium for the disruption of steady, long-term growth.
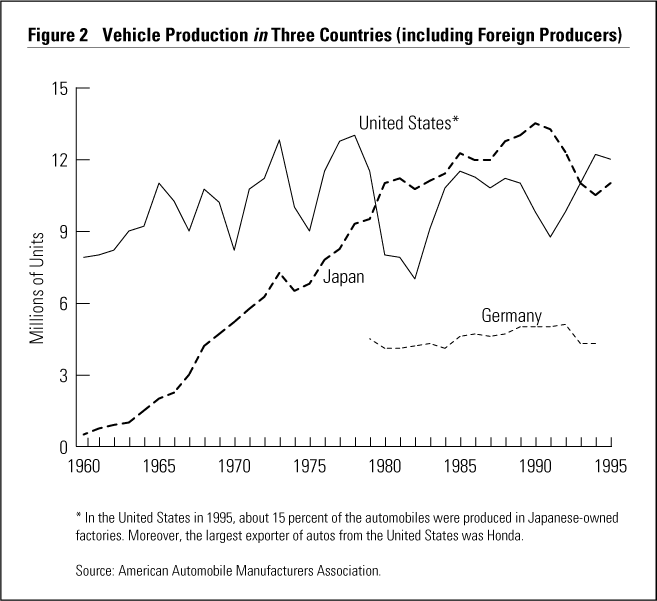
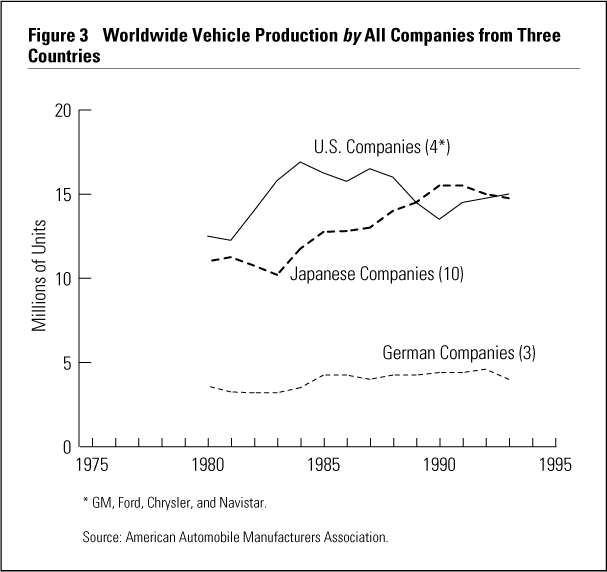
The Japanese automobile industry (and the German industry during the 1980s) exhibited slow, gradual growth compared to the erratic boom-bust cycles of U.S. firms (see Figures 2 and 3). Granted, the well-known Japanese predatory pricing strategies account for some of the stable Japanese growth pattern. In a downturn, the Japanese cut prices deeper than U.S. firms because labor in Japan is a fixed cost. Moreover, U.S. firms withdraw from markets sooner than their Japanese counterparts. William Egelhoff has reported that U.S. firms withdraw from markets “where clear advantage is not possible,” while their Japanese competitors persist even if experiencing losses.15
During market downturns, such as from 1968 to 1970, 1973 to 1975, 1978 to 1982, and 1988 to 1991, the Japanese gained substantial market share. However, during boom times, the rates of sales increase for the Japanese were below the rates experienced by the market as a whole. This means that the Japanese car companies actually lost worldwide market share during market upturns. Does this strategy make sense? We think it does. Implicit in our argument is that stability in boom-bust periods is good for maximizing profits over time.
Tortoise versus Hare
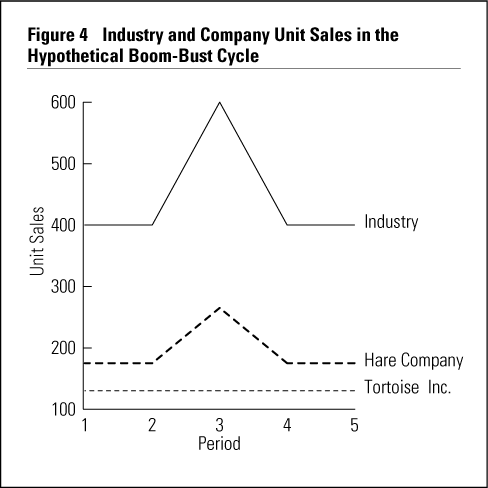
Consider the hypothetical scenario of two companies, Tortoise Inc. and Hare Company. Industry unit sales are stable at 400,000 units (see Figure 4). During the boom phase that begins in period 3, a 50 percent increase in demand brings industry sales to 600,000 units. In period 4, industry sales return to the 400,000 unit level. Tortoise Inc. maintains stable sales at 140,000 units during all periods. Hare Company, on the other hand, chases demand, allowing sales to rise 50 percent in period 3, then returning to prior levels. Which company would you rather work for? Which company would you rather own?
Tortoise Inc.’s market share in period 2 is 35 percent. During the boom in period 3, this company stabilizes sales volume by raising prices and reducing advertising and other selling expenses. This makes sense because a boom period by definition is a “seller’s market,” and buyers seek out sellers during market upturns. Tortoise Inc. also does not tie up expensive capital in inventory and new plant and equipment. Productivity is higher with no training costs for new personnel. Thus profits for Tortoise Inc. will clearly be higher, since revenues increase with the higher prices while costs remain the same. The painless trade-off is a decreased market share to 23 percent for Tortoise.
Rather than being more profitable, market-chasing Hare Company tries the old oxymoron, “We lose money on every sale, but make it up on volume.” It grows at 50 percent between periods 2 and 3, along with the market. To keep up with increased industry demand, Hare Company must spend money in all the ways that Tortoise Inc. did not. Hare Company buys new capital equipment, ties up more money in inventory, and trains new personnel. It cannot afford to match the higher prices that Tortoise charges, since it would stifle its sales growth and spoil its strategy. It must sell faster than Tortoise to keep up with demand and justify its expenditures, which lowers margins. What will make margins magically rise to increase profitability? Nothing. Rates of return on sales and assets will actually fall.
Hare Company and its cohorts will “enjoy” a combined market share of 77 percent but are less profitable. When the boom inevitably ends, Hare Company will be stuck with excess capacity, inventories, and labor. The costs associated with this condition are not trivial. Money tied up in idle capacity and bloated inventories continues to accrue interest. Idle workers squelch productivity before layoffs ensue, incurring severance pay and unemployment compensation.
In contrast, Tortoise Inc. is in a much healthier profit position to cut prices, perhaps even below Hare Company’s, and regain lost market share while maintaining stability in operations. Hare Company, in periods 4 and 5, is also experiencing some of the long-term effects of operational instability. Labor ill-will grows and productivity continues to plummet during the morale “bust” of a painfully shrinking work force. During downsizing, unmeasurably important organizational knowledge and experience are lost forever. Supplier ill-will is another by-product of Hare Company’s actions, as it cancels orders made during the boom that it cannot use during the downturn. Thus, even if Hare Company were somehow able to increase margins and become relatively more profitable during the boom, its profitability would suffer in the long run by succumbing to the temptation of increasing market share. In our hypothetical race, the tortoise once again beats the hare.
Evidence from FTC Data
In addition to the hypothetical example of Tortoise Inc. and Hare Company, an associated study illustrates market share’s negative effect on profitability.16 The study includes observations from the Federal Trade Commission’s Line of Business program, which drew data from more than 3,500 lines of business operated by more than 450 of the largest U.S. manufacturers. The companies were grouped into industrial categories that closely followed SIC (Standard Industrial Classification) codes, totaling 261 separate categories. As with any large-scale study, the data were subject to potential distortions (definition of markets and industries, aggregation bias, accounting procedures, for example), but the magnitude of the study dampened those effects enough as to leave the conclusions’ credibility intact.
The study drew on a subset of forty-two lines of business from the FTC data. They were selected because of their demand volatility in the period under study, 1974 to 1977. Prior research showed that the “foundation goods” category (goods with SIC codes in the 3000 series, i.e., concrete products, including block and brick; fabricated structural metals; elevators and moving stairways; metalworking; machinery; paper industries; buses; railroad equipment) more frequently displays greater demand volatility than any other category. Therefore, the forty-two lines of business represent the eight categories.
These industries experienced at least a 10 percent increase in total sales for the years 1974 to 1975, followed by: (1) at least a 10 percent decrease in sales in 1975 to 1976; (2) at least a 10 percent decrease in 1976 to 1977; or (3) a combined total decrease of 10 percent or greater decrease in the two years, 1975 to 1976, and 1976 to 1977. The 10 percent increase cutoff was chosen after examining the distribution of the percentage change in sales for 1974 to 1975 for the 136 industries that experienced an increase. The mean increase was 17.1 percent. The 10 percent figure ensured a statistically adequate sample.
The study measured return on assets and return on sales. The common measure of return on investment was not used because investment figures were not reported in the FTC data. However, much prior research has shown that the three return measures are highly correlated. The factors that were predicted to influence these financial outcomes were: (1) company size, (2) company sales stability, (3) market share that the company held, and (4) share of the industry’s total investments that the company made in assets and sales expenditures.
Statistical analysis of the FTC data substantiated the study’s four important hypotheses with these results:17
- Businesses that gave up market share in the boom period experienced higher rates of return on assets and sales in subsequent years than those that did not.
- Businesses that experienced sales volatility were less profitable than those that maintained sales stability.
- Larger businesses (measured by assets and gross revenue) were less profitable than smaller businesses during the boom-bust cycle.
- The companies that spent more to increase capacity (assets) and increased selling expenditures were those that increased market share — the same companies that experienced lower profitability after the boom ended.
These results strongly support our thesis: in boom-bust industries, less can be more when it comes to market share. The same may hold true regarding business size. Nimble, small companies can adjust more quickly in volatile environments and squeeze more profit from each dollar of sales. Striving for sales stability, even if it means raising prices and taking other counterintuitive measures, is another smart move that companies large and small can and should make.
Evidence from a Global Perspective
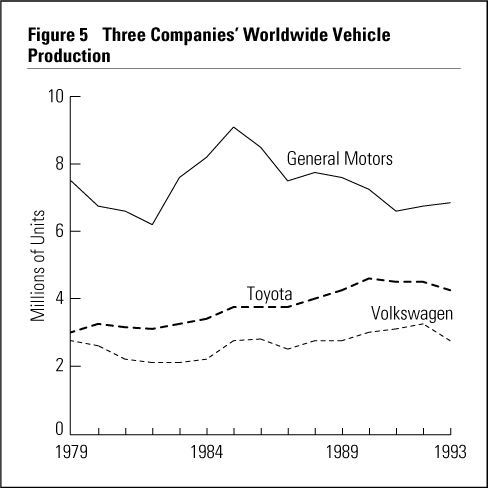
Earlier, we mentioned that Japanese and U.S. auto production levels exhibit culturally based differences in business strategy. Our studies have checked the generality of this notion. For twenty-one triplets of competitive companies (a wide variety of industry leaders in the three countries such as General Motors-Toyota-Volkswagen,General Electric-Hitachi-Siemens, Kodak-Fuji Film-AGFA, AMR Corp.-Japan Airlines-Lufthansa, and Citicorp-DKB-Deutschbank), we compared volatility statistics over a thirteen-year period from 1979 through 1991. On average, the sales of the U.S. firms demonstrated the highest volatility, followed by the German firms, and the Japanese (see Figure 5 as an example).18
Fred Kofman and Peter Senge warn against U.S. firms’ reliance on short-term competition over long-term stability: “We need to ‘beat the competition,’ ‘overcome resistance to our new program,’ ‘squeeze concessions from the labor union,’ or ‘take over this new market.’ We have a metaphorical tunnel vision. . . . Overemphasis on competition also reinforces our fixation on short-term measurable results.”19
Scott Armstrong and Fred Collopy voice their own criticism of U.S. competitiveness. In a simulation, business school students who set market share (competition-oriented) proximate goals achieved lower profits and performance. Their experimental findings were confirmed in a twenty-company empirical study with data for more than fifty years. Armstrong and Collopy cite others who concur with their findings and emphatically conclude, “Firms should ignore their competitors when setting objectives” (that is, sales targets are okay, market share targets are not). Indeed, our own findings are quite consistent with those of Lester Thurow and others who have discussed the German and Japanese emphasis on stability and long-term business relations.20
Occasionally, we hear the objection that the Japanese are more interested in market share than are U.S. executives.21 In a survey, Noboru Makino found that Japanese managers placed a higher premium on market share than U.S. managers did.22 However, we should not be misled by the Japanese “talk”; their “walk” clearly demonstrates their subconsciously higher value for stability. The question, “What’s more important, market share or stable operations?,” is nonsensical from the Japanese perspective. Makino didn’t even think to ask about corporate stability in his survey.
Thus, in the volatility environment, U.S. managers can learn from German and particularly Japanese counterparts.23 Although they are criticized for other aspects of their strategy making, the Japanese have a regard for stability that translates into more profitability in volatile boom-bust industries. Japanese decision-making styles seem to favor a balanced approach to strategic thinking. Henry Mintzberg and his associates describe three ways that strategic choices can be made — through judgment, bargaining, or analysis.24 Japanese consensus making is more akin to the bargaining approach wherein both manufacturing personnel (who focus on stable operations) and marketing personnel (who focus on outflanking competitors) are each given equal say.
In contrast, U.S. managers tend to have a top-down approach on both policy and procedure. This oversimplifies the business environment and reduces the competitive situation to a few variables — one of which invariably tends to be market share. A myopic focus on market share may be disastrous in turbulent industries. If recognition of change and strategic adaptation are key to success in volatile industries, then it follows that peripheral rather than tunnel vision is an important managerial attribute.
Evidence from a Broader Debate
In 1960, Theodore Levitt argued, in “Marketing Myopia,” “There is no such thing as a growth industry; . . . [the graveyard is littered with dead companies caught in a] self-deceiving cycle of bountiful expansion and undetected decay.”25 This seems to support our case against market share grabbing, where prices are cut, output increased, and per-unit cost lowered to “ramp up” production. Levitt’s basic tenet is that growth (particularly steep growth) is secondary and often antithetical to long-term profitability, a belief Peter Drucker seems to share in his comment, “Rapid growth is another sure sign of crisis in an organization’s theory.”26
Some fifteen years later, Robert Buzzell and colleagues argued just the opposite. Buzzell’s analysis of PIMS (Profit Impact of Market Strategies) data purports that there is “no doubt that market share and return on investment are strongly related” for these reasons: economies of scale and the “experience curve” phenomenon, increased market power, and quality of management, all of which are greater in high market share companies.27 He does, however, concede that the importance of market share varies among industries, that is, it is more important for fragmented rather than concentrated industries and for makers of infrequently purchased rather than frequently purchased products. Buzzell points to the example of Shick’s disastrous doubling of its share of the electric shaver market, which led to losses of $14 million on sales of $93.8 million. He also cites William Fruhan, who detailed ill-fated market share grabs in the computer, retail food, and airline industries.28
Even in the face of this and other convincing evidence, many managers stubbornly cling to the market share superstition because it is easy to believe. The ratio of market share is simple and straightforward — up means good, down means bad. But, particularly in volatile industries, the ratio itself can lose its meaning, because both the numerator and denominator change so quickly. The resulting percentage that pops up may lead to strategic decisions that have far-reaching and irreversible consequences with effects that last long after the cycle’s end. Smart managers will instead focus on the individual components of the share and how fast they change. They will calculate the value of the next point of market share and weigh it against cost.29
In a more recent, persuasive academic argument, Buzzell attacked an earlier paper by Jacobson who found the market share-profitability link lacking: “If Jacobson is right, much of what is being taught in leading business schools today is dangerously misleading. Moreover, the rationale for competitive strategies in many companies is flawed. Corporate executives such as General Electric Chairman John Welch, who has publicly stated his goal for GE to be ‘either number one or number two in its arenas’ . . . are misdirecting their efforts.”30
Jacobson is right, and Welch doesn’t necessarily practice his own preaching. In 1988, he dumped RCA, even though it held the highest market share in the U.S. TV industry (third-place worldwide). Welch was implicitly emphasizing profits over market share.
The Portfolio Models
In the strategy chapters of most marketing textbooks is a section on portfolio models. For example, the Boston Consulting Group’s stars, cash cows, dogs, and question marks and the GE Strategic Business Planning Grid are detailed in Philip Kotler’s marketing management text.31 Both decision devices are two-dimensional, with market share prominent on one axis, market growth rate on the other. Both devices rest on three entirely false premises: (1) market share causes profits; (2) market growth can be accurately predicted; and (3) market share can be accurately calculated.
The first we’ve already discussed. With regard to the second, how comfortable would you feel pruning a business unit based on a five-year forecast of demand for that product? Let’s assume you’re Frank Shrontz, the CEO at Boeing. What do you think demand for commercial jets will be in the year 2000? The company’s “boom for the 90s” forecast made in 1991 was way off the mark. If you’re Louis Gertsner at IBM, what do you think the demand for personal computers will be in 2000? If you’re Wayne Calloway at Pepsico, what do you think the demand for high-fat Mexican food (Taco Bell and Chevy’s) will be in 2000?
As for the third premise, exactly how do you define the market for your product to determine the denominator in the market share calculation? Levitt warned about this potential pitfall in 1960. The railroads’ fundamental error was in defining their business as railroads, not transportation. Imagine if Disney saw itself in the education rather than the entertainment industry, or if Coca-Cola saw itself in the nutrition rather than the mouth entertainment industry. If BMW’s market is defined as worldwide auto sales, the Boston Consulting Group portfolio analysis yields a real “dog.” Obviously, a better market definition for BMW is luxury cars. Recently, GTE ran a magazine ad posing the question, “Is it a telephone, a computer, or a television?” How would you define the market for products and services in that fast developing “industry”? Is a Ford Windstar a truck or a car?
This third problem is complicated further by an increasingly fuzzy definition for companies — thereby the numerator in the market share calculation. Joseph Badaracco suggests that demarcations between companies are increasingly blurred because of the burgeoning strategic alliances worldwide.32 How do you count the products of a joint venture such as the wonderfully successful Ford/Nissan Villager/Quest minivan? Ford owns about 33 percent of Mazda. Does that mean you should add that percentage of Mazda’s worldwide production to Ford’s sales when you calculate Ford’s market share? Finally, James Moore argues further about the dangers of focusing on competitors and market share in his discussion of competition between “business ecosystems.”33
Ikujiro Nonaka and Hirotaka Takeuchi criticize portfolio models for omitting the knowledge-creating role of enterprises. That is, when you shed a “dog,” you give up not only a low-growth business unit, but also “unquantifiable human factors, such as values, meanings, and experiences.”34 And the latter may very well be the keys to profitable future operations. Scott Armstrong and his associates attack portfolio planning methods more directly.35 Even Kotler, in the 1994 edition of his textbook, provides 192 words of criticism regarding the portfolio model; that’s not enough. Indeed, if your edition of Kotler is still sitting on your shelf, we suggest you find the portfolio models section and rip those pages out. They are the worst kind of superstition.
Evidence from Other Perspectives
Claes Fornell has attacked market share as a strategic concept from a completely new direction.36 In studies of customer satisfaction in Sweden, he found a negative relationship between market share and customer satisfaction. Particularly in markets where customer preferences are heterogeneous, firms with higher market shares seem to be leaving their clients less satisfied than their low-share competitors do. Similarly, Rohit Deshpande, John Farley, and Frederick Webster warn, “A competitor orientation can be almost antithetical to a customer orientation when the focus is exclusively on the strengths of the competitor than on the current needs of the customer.”37
Hans Thorelli voices a second, related concern in his treatment of network forms of market organization: “In current management practice and research, much is made of the importance of market share as a measure of a firm’s position (and correlate profitability). However, the network paradigm suggests that the quality — the intensity and strength of customer and supplier relations — of a position may be just as important a dimension as its quantitative expression in terms of sales volume or market share.”38
Finally, there are hundreds of “rocket scientists” at business schools and brokerage houses around the country driving their computers on voyages of discovery not unlike Magellan or Cortez in centuries past. Gold is the goal; the vehicle is a computer instead of a caravel. They are searching for flaws in markets, any bit of information that can yield an edge in the data-rich stock and commodity markets. When first discovered, such flaws are money machines. These finance professionals have rejected market share as a predictor of profitability, having concluded long ago that it is a useless concept. They have their own superstitions, but the link between market share and profits isn’t one of them.39
Conclusion
We hope by now you feel quite uncomfortable with your notions about market share. The use of market share as a measure of corporate or executive performance is at best a waste of time; at worst, it is totally misleading. We recommend that you never make the market share calculation. If you emphasize competitive goals, you are letting the competition define your business and its success. Pay attention to sales and the marketplace, but don’t try to combine them into a single number. In stable industries and environments, industry demand (the denominator) is by definition relatively constant, so the calculation of market share yields no new information. In the increasingly volatile markets of today, the denominator in the calculation changes so quickly that market share-based strategies are bound to be bad.40 Some may argue that market share is crucial in high-growth markets where dominant firms set product standards. However, the strategic concept is market dominance, which is a more complex notion than mere market share.
You should focus on stability of operations as a proximate corporate goal — to steadily increase sales. You can reliably measure customer satisfaction and incorporate it as a performance measure. If you have to include stock price as a performance criterion, standardize it by an overall market index that accounts for the relative attractiveness of other investments that the finance folks often ignore, like real estate and CDs.
Fortunately for the Japanese and the stability of their economy, the year of the Fire Horse rolls around only once every sixty years. Unfortunately for Americans and the stability of the U.S. economy, most U.S. managers pay daily homage to the market share god.
References
1. “Women Born in 1966 Stigmatized by Superstition,” Rafu Shimpo, 26 October 1994 (Japan), p. 17;
R.W. Hodge and H. Ogawa, Fertility Change in Contemporary Japan(Chicago: University of Chicago Press, 1991).
2. Fortune avoids the market share trap when its researchers measure the reputations of corporations. See:
“Corporate Reputations,” Fortune, 6 March 1995, pp. 24–44.
More typically, Dorn P. Levin falls into the trap when he quotes Lou Ross, a top executive at Ford in the 1980s: “We considered our natural share of the market about 25 percent. . . . In the worst ten-day reporting periods following the [1970s] fuel crisis, our share dropped to 12 percent.” [page 18] Ironically, Levin ends his article with the following quote, which supports our basic thesis: “The automobile business is cyclical. Even a mediocre automaker should make money —money it needs to develop new models — when the economy is expanding. The trick is not to pile up losses when the market for vehicles turns weak in an economic recession, as it did in the early 1980s and early 1990s, and as it inevitably will again.” See:
D.P. Levin, “How Ford Finally Found the Road to Wellville,” LA Times Magazine, 10 March 1996, p. 42.
3. P. Kotler, Marketing Management, 8th ed. (Englewood Cliffs, New Jersey: Prentice Hall, 1994).
4. W. Baldwin, “The Market Share Myth,” Forbes, 14 March 1983, pp. 109–115;
R.G. Hamermesh, M.S. Anderson and J.E. Harris, “Strategies forLow Market Share Businesses,” Harvard Business Review, volume 56, May–June 1978, pp. 95–102; and
C.Y. Woo and A.C. Cooper, “Evaluation of the Strategies and Performance of Low ROI Market Share Leaders,” Strategic Management Journal, volume 4, April–June 1983, pp. 123–135.
5. L.W. Phillips, D.K. Chang, and R.D. Buzzell, “Product Quality, Cost Position, and Business Performance: A Test of Some Key Hypotheses,” Journal of Marketing, volume 47, Spring 1983, pp. 26–43;
R.D. Buzzell, B.T. Gale, and R.G.M. Sultan, “Market Share — A Key to Profitability,” Harvard Business Review, volume 53, January–February 1975, pp. 97–106;
R.D. Buzzell and F.D. Wiersema, “Modeling Changes in Market Share: A Cross-Sectional Analysis,” Strategic Management Journal, volume 2, January–February 1981, pp. 27–42;
R. Jacobson and D.A. Aaker, “Is Market Share All That It’s Cracked Up to Be?,” Journal of Marketing, volume 49, Fall 1985, pp. 11–22; and
C. Anterasian and L.W. Phillips, “Discontinuities, Value Delivery, and the Share-Returns Association: A Re-Examination of the ‘Share Causes Profits’ Controversy” (Cambridge, Massachusetts: Marketing Science Institute Report No. 88–109, October 1988).
6. C. Anterasian, “Disentangling Rival Hypotheses among Marketing Expenditures, Market Share, and Profitability” (Stanford, California: Stanford University, Ph.D. dissertation, 1986); and
D. Schendel and G.R. Patton, “A Simultaneous Equation Model of Corporate Strategy,” Management Science, volume 24, November 1978, pp. 1611–1621.
7. Jacobson and Aaker (1985).
8. K.J. Clancy and R.S. Shulman, Marketing Myths That Are Killing Business (New York: McGraw-Hill, 1994), p. 29.
9. C. Anterasian and J. Graham, “When It’s Good Management to Sacrifice Market Share,” Journal of Business Research, volume 19, 1989, pp. 187–213; Anterasian (1986); and
W. Bishop, J.L. Graham, and M.H. Jones, “Volatility of Derived Demand in Industrial Markets and Its Management Implications,” Journal of Marketing, volume 48, Fall 1984, pp. 95–103.
10. J. Flanigan, “UAW and Ford Will Sign Deal: Strike at GM?,” Los Angeles Times, 16 September 1987.
11. See L.G. Franko, “The Japanese Juggernaut Rolls on,” Sloan Management Review, volume 37, Winter 1996, pp. 103–109. Obviously, we do not like his market-share-based analyses, but his overall point that Japan is still prominent is salient.
12. Our favorite quote is: “No wonder the wits at AT&T Corporation quip that chairman Robert Allen will soon fire everyone but himself, and AT&T will stand for Allen & Two Temps.” See:
A. Underwood, J. McCormick, and D. Branscorne, “The Hit Men,” Newsweek, 26 February 1996, pp. 44–48.
13. L.J. Krajiewski, B.E. King, L.P. Rizman, N. Weiner, and D.S. Wong, “A Comparison of Japanese and American Systems for Inventory and Production Management: A Simulation Approach” (American Institute for Decision Sciences, Proceedings of the 13th Annual Meeting, 1981), pp. 1109–1111.
14. A. Morita, “When Sony Was an Up-and-Comer,” Forbes, 6 October 1986, pp. 98–102.
15. W. Egelhoff, “Great Strategy or Great Strategy Implementation — Two Ways of Competing in Global Markets,” Sloan Management Review, volume 34, Winter 1993, pp. 37–50.
16. Anterasian and Graham (1989).
For another paper taking into account market volatility, see:
D.O. Mckee, P. Rajan Varadarajan, and W.M. Pride, “Strategic Adaptability and Firm Performance: A Market Contingent Perspective,” Journal of Marketing, volume 53, July 1989, pp. 21–35.
17. Anterasian and Graham (1989). The various hypotheses were tested using correlation coefficients and regression analyses. The findings summarized here are all statistically significant at the p < 0.05 level.
18. Volatility was defined in two ways. The first was averaging the absolute value of the percentage change in sales across the years of study. The second averaged percentage change for the years of sales declines. We found statistically significant differences (p < 0.05) between U.S. and Japanese volatility for the second measure of volatility.
19. F. Kofman and P.M. Senge, “Communities of Commitment: The Heart of Learning Organizations,” Organizational Dynamics, volume 22, Autumn 1993, pp. 5–22.
20. J.S. Armstrong and F. Collopy, “Competition Orientation: Effects of Objectives and Information on Managerial Decisions and Profitability,” Journal of Marketing Research, volume 33, May 1996, pp. 188–199;
L. Thurow, Head to Head (New York: Morrow, 1992).
Kazuo Inamori does not once use the words “market share.” Instead, listed strategic goals are increasing revenues, decreasing costs, employee personal growth, customer satisfaction, incremental improvements across the board, and stability. See:
K. Inamori, A Passion for Success (New York: McGraw-Hill, 1995). Alternatively, Donald Petersen, while emphasizing people (i.e., team-work, participative management, and employee involvement) and quality (i.e., in the best traditions of Deming) as the keys to running a successful enterprise, uses the term “market share” some seventeen times beginning on page xiv! See:
D. Peterson, A Better Idea: Redefining the Way America Works (Boston: Houghton-Mifflin, 1991).
One of our colleagues has made the point that the Japanese are more interested in long-term market share gain — a look at Figure 2 certainly supports that notion. But we believe the Japanese emphasis on stability to be the key factor influencing the patterns in our data. See also:
A.G. Hallsworth, The New Geography of Consumer Spending: A Political Economy Approach (London: Belhaven Press, 1992).
21. For agreement on this point, see:
J.C. Abbegglen and G. Stalk, Jr., Kaisha, The Japanese Corporation (New York: Basic Books, 1985), pp. 176–177, 276.
Also, the newly appointed CEO at Toyota Corporation recently said, “I intend to do whatever I can do to regain our market share.” See:
“Chop Shop,” Newsweek, 21 August 1995, p. 44.
Alternatively, Yoshihide Munekuni, executive vice president at Honda, has said, “Gaining market share is not important.” See:
“Trying to Rev Up: Can Japan’s Car Makers Regain Lost Ground?,” Business Week, 24 January 1994, p. 32.
Finally, there also appears to be a bit of disagreement among U.S. executives. See:
J.B. Treece, K. Kerwin, and H. Dawley, “Ford,” Business Week, 3 April 1995, pp. 94–104.
Regarding CEO Alex Trotman’s stated corporate goal of a 30 percent U.S. market share, “Rivals ask whether it’s a goal even worth pursuing. ‘Why? What’s the value of being big?’ asks Chrysler president Robert A. Lutz. He argues that chasing market share just leads to ‘buying’ sales with excess incentives.” [p. 97]
22. N. Makino, “The Advantages of Japan’s Management Strategy,” Economic Eye, Autumn 1992, pp. 18–21.
In an earlier study by other Japanese researchers, more equivocal findings are reported: Japanese managers ranked “increase in market share” as a more important corporate goal than did comparable Americans, but those same Americans expressed greater agreement than did the Japanese with the statement, “Your company consistently seeks high market share and tries to take advantage of cost efficiencies in every market” (both differences were statistically significant, p < 0.05). See:
T. Kagono, I. Nonaka, K. Sakakibara, and A. Okumura, Strategic vs. Evolutionary Management: A U.S.-Japan Comparison of Strategy and Organization (Amsterdam: North-Holland, 1985).
23. The relatively greater emphasis on stability of Japanese and German companies’ strategies is further well supported by a variety of observations. See, for example:
Thurow (1992).
Regarding hurdle rates, see:
J.M. Poterba and L.H. Summers, “A CEO Survey of U.S. Companies’ Time Horizons and Hurdle Rates,” Sloan Management Review, volume 36, Fall 1995, pp. 43–53.
See also:
B. Powell, “Keep Your Profits,” Newsweek, 6 November 1995, p. 98; and
N.A. Nichols, “Efficient? Chaotic? What’s the New Finance?,” Harvard Business Review, volume 71, March–April 1993, pp. 50–59.
Related to German companies, in particular, see:
“Dreaming of Butterflies,” The Economist, 26 June 1993, pp. 65–67;
H. Simon, “Lessons from Germany’s Midsize Giants,” Harvard Business Review, volume 70, March–April 1992, pp. 115–123; and
K.S. Weven and C.S. Allen, “Is Germany a Model for Managers?,” Harvard Business Review, volume 70, September–October 1992, pp. 36–43.
24. H. Mintzberg, “Strategy Making in Three Modes,” California Management Review, volume 16, Winter 1973, pp. 44–53.
25. T. Levitt, “Marketing Myopia,” Harvard Business Review, volume 38, July–August 1960, pp. 52–53.
26. P. Drucker, “The Theory of Business,” Harvard Business Review, volume 72, September–October 1994, p. 103.
Regarding retailing, Al Ries attributes the great success of Toys ‘R’ Us over rivals such as Child World and Kiddie City to founder Charles Lazarus’s emphasis on “market share, market share, market share” (page 69). But, unconsciously consistent with our views are Ries’s further descriptions of Wal-Mart, not a direct competitor, currently undercutting Toys ‘R’ Us’s prices and “market dominance.” We believe that a market share strategic focus such as that expressed so clearly by Lazarus leads quite directly to an unhealthy, narrow vision of the future. See:
A. Ries, Focus: The Future of Your Company Depends on It (New York: Harper Business, 1996).
27. Buzzell, Gale, and Sultan (1975).
28. W. Fruhan, “Pyrrhic Victories in Fights for Market Share,” Harvard Business Review, volume 50, September–October 1972, pp. 100–107.
29. V. Cook, “The Net Present Value of Market Share,” Journal of Marketing, volume 49, Summer 1985, pp. 49–53.
30. R. Buzzell, “Commentary on ‘Unobservable Effects and Business Performance,’” Marketing Science, volume 9, Winter 1990, pp. 86–87.
31. Kotler (1994).
32. J. Badaracco, The Knowledge Link — How Firms Compete Through Strategic Alliances (Boston: Harvard Business School Press, 1991).
33. J.F. Moore, The Death of Competition, Leadership and Strategy in the Age of Business Ecosystems (New York: Harper Business, 1996).
34. I. Nonaka and H. Takeuchi, The Knowledge-Creating Company (New York: Oxford Press, 1996), p. 41.
35. J.S. Armstrong and R.J. Brodie, “Effects of Portfolio Planning Methods in Decision Making: Experiential Results,” International Journal of Research in Marketing, volume 11, 1994, pp. 73–84.
36. C. Fornell, “A National Customer Satisfaction Barometer: The Swedish Experience,” Journal of Marketing, volume 56, January 1992, pp. 6–21.
37. R. Deshpande, J.N. Farley, and F.E. Webster, Jr., “Corporate Culture, Customer Orientation, and Innovativeness in Japanese Finance: A Quadrad Analysis,” Journal of Marketing, volume 57, January 1993, pp. 23–37.
38. H. Thorelli, “Networks: Between Markets and Hierarchies,” Strategic Management Journal, volume 7, 1986, pp. 37–51.
39. Nichols (1993).
40. Because overall soft-drink demand is stable over time, Pepsi focuses on Coke’s strategic moves. For them, a focus on market share is the same as a focus on sales revenues. Alternatively, in highly volatile businesses like commercial aircraft or automobiles, Boeing and Ford have to pay careful attention to both their competitors and cyclical market demand. For Boeing and Ford, increases in market share can still mean declines in sales revenues, depending on where the overall market is headed. Thus market share goals can be quite misleading. Pepsi may be engaged in a tough “waterpolo” match against Coke, but at least the pool water is warm and calm. Boeing and Ford are playing their matches in the Colorado River rapids. For them, it’s crucial to keep one eye on their competitiors but focus their better eye on the rocks and white-water of fast fluctuating market demand. For them, simply calculating market share induces a blurry tunnel vision.