Navigating a Path to Smart Growth
Not all growth is good. An analysis of Fortune Global 500 companies shows that the businesses that grew within the limits of their growth corridors performed far better than others — even those that grew faster.
Topics
How fast should a company grow? This question is fundamental to managerial practice, and it is difficult to answer. On the one hand, companies need to grow to remain vital and competitive. On the other hand, growth creates a number of managerial challenges — and too much growth can lead to crises or even bankruptcy. Some researchers have suggested that growth is beneficial only up to a certain point, beyond which it destroys shareholder value.1 This raises a set of questions: Do companies have optimal growth rates? Can healthy growth be defined? And if so, how can managers determine the ideal growth rate for their organizations?
We have developed a model of a “growth corridor” that allows managers to determine how quickly their companies can safely grow. We tested this model using a large-scale empirical study of the growth paths of the Fortune Global 500 between 1995 and 2004.2 (See “About the Research”) The results confirm the growth corridor’s relevance for managerial practice: Companies that grew within the limits set by their growth corridor outperformed their peers that did not. So-called “smart growers” delivered an average return to shareholders of nearly double the rate of slower- or faster-growing companies. These companies, including Dell, General Electric, Microsoft, Nestlé, Toyota and Wal-Mart, operated within the limits of their growth corridors. However, more than 75% of the overall group failed to operate within this zone and paid a price one way or another — in rising debt, declining profit margins or falling share prices. Drawing lessons from the smart growers, we have developed guidelines for how managers can use the growth corridor model in strategic planning.
The Growth Corridor
Many executives do not see rapid growth as a serious problem. After all, when companies are able to grow, they generally are offering customers what they want. However, in many cases there are significant costs, resulting in financial losses, market-share declines and even bankruptcy. Executives must balance a company’s need to grow with its ability to manage the growth. The growth corridor is the path companies can take toward smart growth, between their “minimum growth” and “maximum growth” rates.
Minimum Growth
Companies reap multiple benefits from growth. Increased size and market share often lead to more market power and better economies of scale and scope. Fast-growing companies are able to attract strong management talent and financial resources. In addition, growth can help companies overcome inertia and renew themselves, which is critical in changing market environments. Growth is, therefore, an important indicator of corporate health and success.3 Based on management theory and practice, three things influence a company’s minimum growth rate: (1) competitive growth, (2) shareholder growth expectations and (3) productivity growth.
Competitive growth.
As found during empirical research, companies that fail to defend their competitive position aggressively expose themselves to negative performance and are more prone to failure.4 The recent experience of Bayer AG, the German-based healthcare and nutrition giant, is instructive. In 1993, Bayer was among the top three players in the global pharmaceutical industry, but by 2005 it had fallen to 18th place. Today, Bayer lacks the resources to make the necessary investments in research and development to be competitive. A company’s ability to achieve competitive growth against major competitors in its sector is the first indicator that it can achieve minimum growth.5
Shareholder growth expectations.
Empirical research shows that, independent of a company’s absolute performance, there is a reward for meeting the long-term growth expectations of shareholders and a penalty for failing to do so.6 For example, Dell Inc.’s stock price fell by 11% in the seven days following the company’s announcement that its 2005 earnings would fall short of expectations. Therefore, a second indicator of a company’s minimum growth requirement is contained in the long-term growth expectations that are discounted into the company’s current share price.
Productivity growth.
Over time, as companies learn, they need fewer employees to produce the same output in products or services. Productivity improvements continuously free up resources that can be either redeployed to produce more or disposed of through downsizing. Evidence indicates that continuous trimming and downsizing may not be sustainable. Consider the example of General Motors Corp. Constant downsizing since the late 1970s has required the company to invest billions of dollars in severance packages, pensions and restructuring initiatives.7 Empirical studies have shown that, in the long run, targeting growth is far more profitable than continued downsizing.8 A company’s minimum growth requirement to avoid excess capacity and downsizing thus is indicated by its long-term productivity growth rate.
Empirical findings.
Analyzing the different components of growth of the Fortune Global 500 companies over the past decade confirms the importance of all three elements. Companies that realized sales growth exceeding their minimum growth thresholds were significantly more successful in terms of total shareholder returns than companies that failed to do so.9 Although all three factors are relevant, competitive growth may be the most important single factor in a company’s minimum growth. The competitive growth rates of most companies in our sample substantially exceeded their productivity growth rates. In some cases, shareholder growth expectations were excessively high and unrealistic given a company’s market growth potential.10 Competitive growth provides a more realistic indication of minimum growth than shareholder expectations.
Maximum Growth
Even though companies need a minimum amount of growth for long-term survival and performance, too much growth can create problems. It can overburden the company’s ability to manage and lead to a loss of control.11 Furthermore, growth can outstrip financing capabilities. Indeed, one or more of the following factors can determine a company’s maximum growth rate: (1) financial limits, (2) managerial limits and (3) market limits.
Financial limits.
Scholars have suggested that a proxy for a company’s maximum long-term growth rate is the “sustainable growth rate.”12 Sustainable growth refers to the maximum annual sales increase that a business can achieve without impairing target ratios for debt, return on working capital and dividend payouts. It is not uncommon for companies operating above this level to face insolvency.13 WorldCom Inc., for example, realized an average sales growth of 72% per year in the five years prior to its bankruptcy, despite a sustainable growth rate of just 3%.
Managerial limits.
A company’s growth rate can be constrained further by its ability to find, train and integrate new management of sufficient quality at a fast enough rate.14 This was the situation at Hilti Corp., a leader in construction tools, which experienced high growth in 2004 due to a booming construction market. The Liechtenstein-based company found that its managerial control and operational efficiency declined once its growth rate reached 20% per year. A company’s growth thus is limited by its growth in management capacity, or what it can absorb without undermining operational efficiency or further sales growth.
Market limits.
The only way companies can achieve above-market-rate growth in an industry is if they can capture market share from rivals. Empirical research shows that escalating competition for market share can negatively affect profitability.15 Consider the example of the U.S. automotive industry in 2002, when fierce competition between leading players — Chrysler, GM, and Ford — caused a price war that destroyed profitability for all the competitors. A company reaches maximum growth when it begins to purchase share at a cost of lower profitability.16
Empirical findings.
The findings from our analysis of the Fortune Global 500 companies show that financial limits — indicated by a company’s sustainable growth rate — may be more influential for large companies than competitive or managerial limits. Although competition may restrict a company’s growth potential in a given market segment, companies always have an option to diversify into new fields to generate additional growth. Furthermore, large companies can absorb relatively high rates of managerial growth; in most industries, the negative effects on management only became apparent when growth rates exceeded 25%. Although large companies may be able to manage such rates temporarily without suffering operational problems, very few companies in our sample could sustain them over longer periods. By contrast, financial limits posed a far more common limitation. The average sustainable growth rate for the Fortune Global 500 companies over the past decade was 11%, with almost half of the companies seeing sales growth above that rate. The performance implications are significant: Companies that grew within the limits set by their sustainable growth rate achieved a total return to shareholders of 14%; those whose growth rates exceeded the sustainable growth rate saw an average return to shareholders of only 8%.
Smart Growth
A company’s optimum growth path can be determined by estimating the minimum and maximum thresholds of growth. The empirical findings mentioned above suggest that the most relevant thresholds for the companies sampled were their competitive and sustainable growth rates. While additional thresholds can be considered for a more thorough analysis, the initial investigation will be limited to two factors. (See “Identifying the Growth Corridor.”)
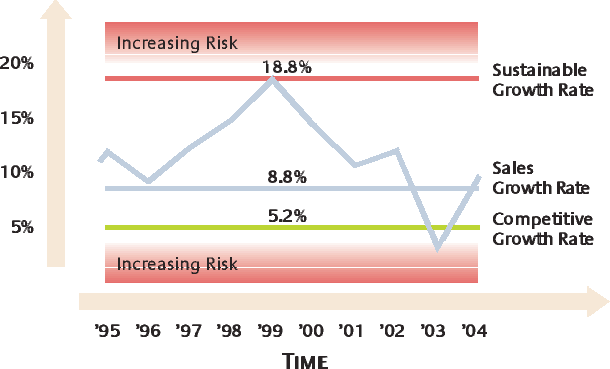
Wal-Mart Stores Inc., the largest company in the Fortune Global 500, provides a good illustration of how the growth corridor works. Between 1995 and 2004, Wal-Mart’s sustainable growth rate (the maximum growth rate) averaged 18.8%, and its competitive growth rate (the minimum growth rate) was 5.2%. Although the company’s sales growth rate showed considerable variation in the short run, the average sales growth for the decade was 8.8% — well within its growth corridor.
Our analysis of the Fortune Global 500 companies confirms the growth corridor’s importance. Over the past decade, only about 25% of the companies increased sales within the limits set by their growth corridor. In doing so, these companies — including GE, Microsoft, Nestlé and Toyota — significantly outperformed their peers, achieving an average annual return to shareholders of 17.5%. Companies that failed to stay within their growth corridors showed average returns of just 9.9%. The companies that consistently exceeded their maximum growth rate paid for excess growth with lower profitability; those that grew below their minimum growth rate achieved short-term profitability at the expense of market position and long-term development.
Smart growers share a number of characteristics. They have a culture oriented to the long term; they set and maintain realistic growth targets; and they pursue growth in sales and in profits simultaneously. Swiss food giant Nestlé S.A. offers an excellent example. Nestlé’s long-term orientation is reflected by its refusal to publish quarterly profit statements. Rather than attempting to maximize growth and profits in the short run, Nestlé CEO Peter Brabeck-Letmathe set a challenging but realistic long-term growth target of 5% to 6%. While the target is twice the growth rate of the global food industry, it is within the company’s growth corridor. Nestlé’s initiatives to foster innovation and organic growth are complemented by programs to improve operating efficiency, leading to margin improvements that have helped generate the cash flow required for investments in further growth.17
Like Nestlé, most smart growers work consistently to improve efficiency, which leads to higher sustainable growth rates. The cash generated by operational improvements can be used to fund ventures in high-growth areas, which can result in increased growth rates over time. Smart growers thus gradually shift their growth corridors to higher levels.18 Rather than maximizing growth in the short run and depleting available resources in expansions that are unsustainable, they incrementally improve theircapacity to grow.19
The Path to Smart Growth
How a company develops a strategy for achieving smart growth depends on its current situation. Recognizing that there are different positions in the growth corridor, we have identified three suboptimal growth situations: (1) cash-starved companies, (2) growth laggards and (3) companies experiencing excessive growth. Companies that have succeeded in growing themselves out of these positions offer some important lessons.
Cash-Starved Companies
More than 35% of the companies sampled were categorized as “cash-starved.” They lacked the financial muscle to grow with the market, which was reflected by having a sustainable growth rate below their competitive growth rate. Since there is no such thing as a corridor for smart growth, a cash-starved company has a Hobson’s choice between two suboptimal behaviors: If the company attempts to grow at the market rate, it risks bankruptcy; but if it agrees to sell less, it may be only postponing failure as its market share declines. Among the cash-starved companies in our sample were AT&T, Deutsche Telekom, Fiat, Motorola and Viacom. The companies’ suboptimal position was reflected in their low average returns to shareholders of just 6.5% per year over the past 10 years — compared to an average of 15.2% per year for other companies.
Companies that grew themselves out of their cash-starved position typically relied on a two-stage approach. First, they increased cash flow and profitability by refocusing on the core business, selling off noncore assets and taking steps to improve operational efficiency. These measures often helped to increase their sustainable growth rate. Once the companies reached a sustainable growth rate that exceeded their competitive growth rate, they regained their “right to grow.” They then could invest in product and market development initiatives aimed at generating new growth.
Bayerische Motoren Werke AG, which experienced a serious cash shortage in 1999 following the disastrous acquisition of the British carmaker Rover Group Ltd. five years earlier, provides a good example of how a cash-starved company can turn things around. (See “BMW: Cash-Starved to Smart Growth.”) CEO Joachim Milberg responded to the crisis by selling off the loss-making Rover and Land Rover units and refocusing the company’s core business of producing and marketing premium cars. At the same time, Milberg launched several initiatives to increase operational efficiency. In three years, the success of these efforts was reflected in the declines in both production costs and sales and administration costs: Production costs fell from 84% of sales in 1999 to 75% in 2002; and sales and administration costs fell from 14% of sales in 1999 to 10% in 2002. BMW’s increase in productivity made it one of the world’s most profitable carmakers. Its sustainable growth rate soared from negative values in the late 1990s to an average of 18.5% in 2000 and 2001.
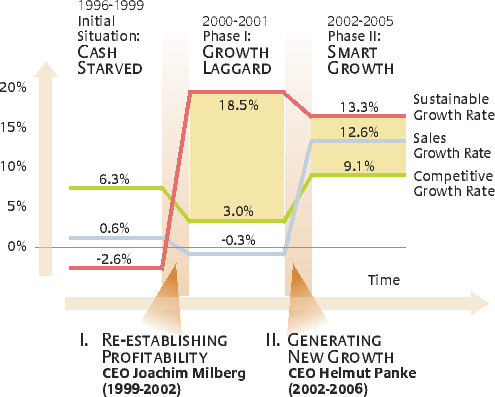
Despite these improvements, the company’s sales growth lagged significantly behind that of its competition. In response, Milberg’s successor, Helmut Panke, launched the largest product expansion in BMW’s history, introducing the new MINI; an updated 3, 5 and 7 Series; the new 1 and 6 Series; the X3 sport utility vehicle and the Rolls-Royce sedan. During this time, the company’s R&D expenditure rose from 4.1% of sales to 5.3%. Since 2002, BMW has outgrown its competitors; in 2005, it overtook DaimlerChrysler AG’s Mercedes Benz as the market leader in premium cars. Through operational improvements (moving the sustainable growth rate to a level above the competitive growth rate) and then investing the increased returns in organic growth (to accelerate the actual sales to a smart pace), BMW was able to return to smart growth.20
Other well-known companies have used similar strategies to move out of their cash-starved positions: Porsche in 1993; Apple in 1997; Sears in 1999; and Deutsche Bank in 2002.21 Such experiences demonstrate that active emphasis on improving profit margins and asset turnover along with reducing debt loads can open up new opportunities for growth.
Growth Laggards
In contrast to cash-starved companies, those we categorize as “growth laggards” have the financial muscle to grow with the market, which is reflected in having sustainable growth rates above the competitive growth rate. However, the sales increases of these companies have fallen behind the competitive growth rate. Consequently, they experience continuous erosion of their market share. The growth laggards show an average return to shareholders of 10.9%, compared to the 16.9% average displayed by companies whose sales grew faster than the market. Approximately 18% of the companies in our sample were in this group, including Eastman Kodak, German power company E.On, Ford, Unilever and Xerox. Their inability to fuel new growth is not due to a lack of market potential or a lack of financial means. Rather, it commonly stems from an ingrained resistance to change. For a variety of reasons, the organizations are unable to renew and restructure themselves.22
Companies that have managed to overcome inertia and return to smart growth often have pursued large-scale innovation initiatives. While product innovations frequently have been at the heart of these initiatives, few companies have been successful in these transitions without adopting new business models (for example, adopting new sales channels or pricing models) and new processes. Promoting organic growth typically involves a coordinated effort across the entire company. In addition, it often requires more fundamental cultural change programs to make the changes stick.
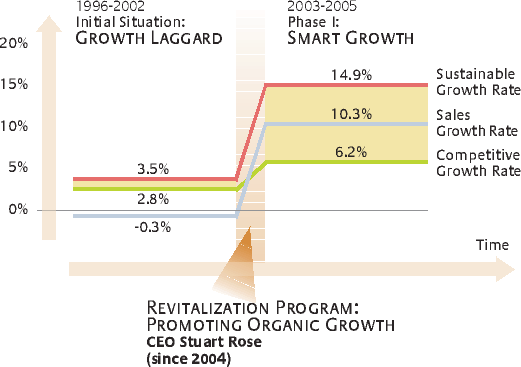
Consider the case of Marks & Spencer Group plc, the London-based retailer. For more than 100 years, the company had been a market leader and one of the world’s most profitable retailers. Lately, however, M&S lagged behind its competitors in terms of sales growth. (See “Marks & Spencer: Growth Laggard to Smart Growth.”) Its competitors offered cheaper and more stylish clothing, causing M&S customers to question whether they were still getting value for their money. Despite a 30% drop in market share between 1996 and 2002, M&S was rigidly clinging to its traditional focus on product quality rather than style, price or store design.23 Under a new CEO, Stuart Rose, M&S invested heavily in new product lines. Additional innovations, including store modernizations, aggressive advertising and innovative marketing campaigns, helped lure back millions of customers. Rose financed these activities through efficiency gains, which were achieved through supply chain improvements and intensified foreign sourcing. These efforts were accompanied by significant changes in management and personnel and the adoption of a more entrepreneurial work environment. In the past three years, M&S has regained its market share and returned to smart growth.24

Like Marks & Spencer, other growth laggards such as Coca-Cola, Eastman Kodak and Xerox have implemented revitalization programs to stem losses in market share. However, many growth laggards are finding that investment in innovation activities is not enough. The investments must be coupled with fundamental changes in corporate culture.25
Companies Experiencing Excessive Growth
In contrast to growth laggards, companies experiencing “excessive growth” managed to outgrow the competition. Yet they grew so rapidly that their financial means were stretched to the limit. Some suffered increased levels of organizational complexity, sharply rising debt loads and, ultimately, a higher risk of bankruptcy. Some of the most prominent dropouts from the Fortune Global 500 were excessive growers, such as Enron, Marconi Medical Systems, Swissair and WorldCom. Approximately 21% of the companies in our sample, including Cendant,26 Vodafone, French power supplier SUEZ and manufacturing conglomerate Tyco, displayed signs of excessive growth.
Companies that successfully managed to move back to smart growth mostly relied on some type of stabilization program. These programs typically were composed of three related measures. First, since excessive growth often leads to massive debt burdens, companies implemented retrenchment activities (such as selling off assets, restructuring debt and cutting costs). These measures helped the companies improve their run rates and cash positions while also increasing their sustainable growth rates. Simultaneously, the companies adjusted their growth strategies by moving from aggressive acquisitions to more moderate, organic growth. By adjusting their growth targets, they reduced sales growth to more sustainable levels. Finally, they made organizational adjustments to increase corporate control and integrate their various businesses, thereby instilling a better sense of companywide discipline and accountability.
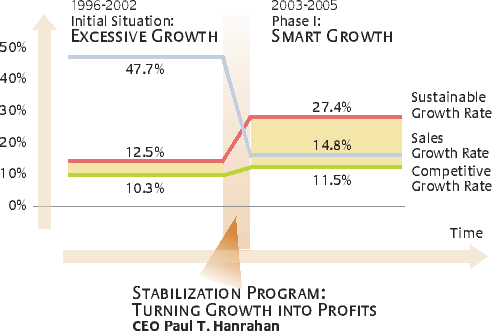
The AES Corp., a global power producer based in Arlington, Virginia, faced a huge challenge in 2002. A series of acquisitions had left the company especially vulnerable to a collapse in energy prices and an economic meltdown in Latin America, where half of its assets were located. Between 1996 and 2002, the company’s revenues had increased by an average of 47% per year — almost four times its sustainable growth rate. (See “AES: Excessive Growth to Smart Growth.”) Its long-term debt soared from $2.1 billion to $23.2 billion, and its shares fell from $70 a share to less than $1. In June 2002, CEO Paul T. Hanrahan announced a major retrenchment. AES cut capital expenditures by half, sold more than $1 billion in underperforming assets and began drastic cost-cutting. Hanrahan replaced the company’s ambitious growth targets with more balanced objectives. Although AES continued to pursue smaller acquisitions, its new focus was on organic growth. Hanrahan also did away with the company’s decentralized structure in favor of a more disciplined and integrated approach.27 In an effort to improve control and coordination, the company expanded its central staff from 50 to 250 employees. Over the next four years, AES became far less leveraged and increasingly profitable. It returned to smart growth in 2004, with sales growth stabilizing and sustainable growth rate increasing. By early 2007, the company’s stock price was hovering in the $20 range.
Examples such as AES show that companies have the potential to rebuild after periods of excessive growth without being irreparably damaged in the long run. Other companies, including Cendant, DaimlerChrysler and Vodafone, are in the midst of implementing stabilization programs to return to smart growth. History shows that there can be a fine line between aggressive expansion and overstepping the limits. The business landscape is littered with the remains of once high-flying companies.
Even though there are times when companies are tempted by opportunities to achieve rapid growth, there should be enough examples of companies that grew too fast to make managers extremely wary. Smart growth needs to be within a company’s growth corridor. By defining the growth corridor, companies gain an important benchmark for what they realistically can accomplish. As events unfold, a company’s actual growth rate may be higher or lower than the bounds set by the corridor. However, a continued disparity between actual growth and the growth corridor should prompt managers to take whatever steps are needed to maintain the internal balance.
References
1. See E. Penrose, “The Theory of the Growth of the Firm” (Oxford: Oxford University Press, 1959); C.A. Ramezani, L. Soenen and A. Jung, “Growth, Corporate Profitability, and Value Creation,” Financial Analysts Journal 58, no. 6 (2002): 56–67; and D.A. Whetten, “Organizational Growth and Decline Processes,” Annual Review of Sociology 13 (1987): 335–358.
2. The Fortune Global 500 is a ranking of the top 500 corporations in the world as measured by revenue. It differs from the Fortune 500 in that the latter only lists the top U.S. corporations. The list is compiled and published annually byFortune magazine. We used the list published in the July 25, 2005, issue.
3. For recent publications on corporate growth, please refer to J. Canals, “Managing Corporate Growth” (Oxford: Oxford University Press, 2000); C.M. Christensen and M. Raynor, “The Innovator’s Solution: Creating and Sustaining Successful Growth” (Boston: Harvard Business School Press, 2003); and J. McGrath, F. Kroeger, M. Traem and J. Rockenhaeuser, “The Value Growers: Achieving Competitive Advantage Through Long-Term Growth and Profits” (New York: McGraw-Hill, 2001).
4. Two interesting studies on competitive rivalry effects on company performance are W.J. Ferrier, K.G. Smith and C.M. Grimm, “The Role of Competitive Action in Market Share Erosion and Industry Dethronement: A Study of Industry Leaders and Challengers,” Academy of Management Journal 42, no. 4 (1999): 372–388; and G. Young, K.G. Smith and C.M. Grimm, “ ‘Austrian’ and Industrial Organization Perspectives on Firm-Level Competitive Activity and Performance,” Organization Science 7, no. 3 (1996): 243–254.
5. Similarly, management consultant Peter F. Drucker stated: “A company needs a viable market standing. If the market expands ... a company has to grow with the market to maintain its viability.” See P.F. Drucker, “Management: Tasks, Responsibilities, and Practices” (New York: Harper & Row, 1973), 774.
6. See E. Bartov, D. Givoly and C. Hayn, “The Rewards to Meeting Or Beating Earnings Expectations,” Journal of Accounting and Economics 33, no. 2 (2002): 173–204; R. Kasznik and M.F. McNichols, “Does Meeting Earnings Expectations Matter? Evidence From Analyst Forecast Revisions and Share Prices,” Journal of Accounting Research 40, no. 3 (2002): 727–759; and D. Skinner and R. Sloan, “Earnings Surprises, Growth Expectations, and Stock Returns Or Don’t Let an Earnings Torpedo Sink Your Portfolio,” Review of Accounting Studies 7, no. 2–3 (2002): 289–312.
7. Currently, the legacy costs from downsizing add $2,000 to the cost of every vehicle, explaining GM’s failure to produce cars at a competitive level; see A. Sloan, “Against Toyota, GM Needs to Mind the Gap,” Washington Post, Feb. 28, 2006, p. D.02.
8. For an overview of the literature on downsizing effects on firm performance, see W. Cascio, “Downsizing: What Do We Know? What Have We Learned?” Academy of Management Executive 7 (1993): 95–104; and C. Chadwick, L.W. Hunter and S.L. Walston, “Effects of Downsizing Practices On the Performance of Hospitals,” Strategic Management Journal 25, no. 5 (2004): 405–427.
9. Firms whose sales growth exceeded productivity growth achieved an average return to shareholders of 13.8% compared to an average of 7.3% for firms whose sales growth lagged behind productivity growth. Similarly, firms exceeding shareholders’ growth expectations showed an average return of 15.4%, clearly outperforming firms that failed to meet expectations (average return of 8.7%). Finally, firms that grew faster than the competition realized an average return of 14.4% — almost twice the average return of 7.8% achieved by firms that grew more slowly than the competition.
10. This observation is in line with earlier studies that found growth expectations to be occasionally biased by irrational investor behavior. See, for example, W.F. De Bondt and R. Thaler, “Does the Stock Market Overreact?” Journal of Finance 40 (July 1985): 793–805.
11. For additional insights on the risks related to rapid growth, see J.P. Gander, “Managerial Intensity, Firm Size and Growth,” Managerial and Decision Economics 12 (1991): 261–266; D.C. Hambrick and L.M. Crozier, “Stumblers and Stars in the Management of Rapid Growth,” Journal of Business Venturing 1, no. 1 (1985): 31–45; and M. Slater, “The Managerial Limitations to the Growth of Firms,” Economic Journal 90 (September 1980): 520–528.
12. The sustainable growth model has been well established in prior research. The most relevant studies include J. Clark, T. Chiang and G.T. Olson, “Sustainable Corporate Growth: A Model and Management Planning Tool” (Westport, Connecticut: Quorum Books, 1989); R.C. Higgins, “How Much Growth Can a Firm Afford?” Financial Management (fall 1977): 7–16; and P. Varadarajan, “The Sustainable Growth Model: A Tool For Evaluating the Financial Feasibility of Market Share Strategies,” Strategic Management Journal 4, no. 4 (1983): 353–367.
13. Two interesting studies on the subject are T. Opler and S. Titman, “Financial Distress and Corporate Performance,” Journal of Finance 49, no. 3 (1994): 1015–1040; and G. Probst and S. Raisch, “Organizational Crisis: The Logic of Failure,” Academy of Management Executive 19, no. 1 (2005): 90–105.
14. The managerial limitation on growth is well described in the literature, and empirical studies have confirmed that a firm’s growth is constrained by “managerial capacity.” Please see J.P. Gander, “Managerial Intensity, Firm Size, and Growth,” Managerial and Decision Economics 12 (1991): 261–266; M. Slater, “The Managerial Limitation to the Growth of Firms,” Economic Journal 90 (September 1980): 520–528; and D. Tan, “The Limits to the Growth of Multinational Firms in a Foreign Market,” Managerial and Decision Economics 24 (2003): 569–582.
15. See C.A. Montgomery and B. Wernerfelt, “Sources of Superior Performance: Market Share Versus Industry Effects in the U.S. Brewing Industry,” Management Science 37, no. 8 (1991): 954–959; and K.G. Smith, W.J. Ferrier, and C.M. Grimm, “King of the Hill: Dethroning the Industry Leader,” Academy of Management Executive 15, no. 2 (2001): 59–70.
16. Along the same lines, Drucker argues: “Growth that exceeds the optimum, that is, growth that purchases market position at the price of lower productivity ... is basically unsound and cannot be sustained.” “Management,” 775.
17. Nestlé’s growth strategy is described in detail in S. Raisch and F. Ferlic, “Nestlé: Sustaining Growth in Maturing Markets,” University of St. Gallen case no. 306-615-1 (Bedfordshire, United Kingdom: ECCH, 2007).
18. Studies have shown that higher sustainable growth rates are linked to higher long-term performance. See, for example, R.C. Higgins, “Sustainable Growth Under Inflation,” Financial Management (autumn 1981): 36–40.
19. See also G. von Krogh and M. Cusumano, “Three Strategies for Managing Fast Growth,” MIT Sloan Management Review 42, no. 2 (winter 2001): 53–61.
20. For a detailed account of BMW’s growth, see S. Raisch and A. Zimmermann, “Changing Fortunes: Corporate Growth at DaimlerChrysler and BMW,” University of St. Gallen case no. 306-192-1 (Bedfordshire, United Kingdom: ECCH, 2006).
21. Studies on corporate restructuring suggest a similar two-phased approach. See K. Arogyaswamy, V.L. Barker and M. Yasai-Ardekani, “Firm Turnarounds: An Integrative Two-Stage Model,” Journal of Management Studies 32 (1995): 493–525.
22. A number of prior studies on corporate decline pointed to the fact that organizations tend to get trapped in their previous success patterns and lose their flexibility to change and adapt (the so-called “success breeds failure” phenomenon). Readers interested in this topic are referred to D. Miller, “The Icarus Paradox: How Exceptional Companies Bring About Their Own Downfall” (New York: Harper Collins, 1992).
23. For more information, see J. Bevan, “The Rise and Fall of Marks & Spencer” (London: Profile Books, 2001).
24. For a detailed account of Marks & Spencer’s revitalization program, also see Probst and Raisch, “Organizational Crisis,” 98, 101–102.
25. Empirical studies have shown that bureaucratic and risk-averse cultures are linked to a low degree of innovativeness. See R. Deshpandé, J.U. Farley and F.E. Webster, Jr., “Corporate Culture, Customer Orientation, and Innovativeness in Japanese Firms: A Quadrad Analysis,” Journal of Marketing 57, no. 1 (1993): 23–37.
26. Cendant, formerly a real estate and travel conglomerate, was split into four independent companies. It is now comprised principally of its vehicle rental operations. Following stockholder approval on August 29, 2006, the company changed its name to Avis Budget Group Inc.
27. See also M. McNeil Hamilton, “AES’s New Power Center: Struggling Utility Overhauls Corporate (Lack of) Structure,” Washington Post, June 2, 2003, p. E.01.