Preparing for Disruptions Through Early Detection
Unexpected events — ranging from extreme weather to product contamination — can easily disrupt businesses in today’s complex, interconnected global economy. The good news? A company can substantially increase its resilience by improving its ability to detect — and respond to — disruptions quickly.
Topics
In 2008, the Black Thunder mine in Wyoming’s Powder River Basin — the largest coal mining complex in the United States, owned by St. Louis, Missouri-based Arch Coal Inc. — planned to install a massive new conveyer tube to move coal to a silo for loading trains. When David Freeman, vice president of engineering at BNSF Railway Co. at the time, heard of the mine’s plans, he wanted to be sure the railroad had input. The mine planned to hire a 2.7-million-pound crane to hoist the 260-foot long, 500,000-pound conveyer tube 150 feet into the air and place it on pylons. The intricate installation process would suspend the tube over three tracks on which 80 BNSF and Union Pacific Railroad Co. trains traveled every day, carrying almost 1 million tons of coal to fuel power plants all across the Midwest and the East Coast. Overall, one-third of America’s transported coal would pass on the rails under that 260-foot long tube.
Freeman’s role was to review the mine’s plans and ensure close coordination to minimize service interruptions to BNSF’s customers. Thus, BNSF and Union Pacific halted traffic while the crane was scheduled to perform its delicate maneuver on a Saturday in May 2008. Freeman also sent two repair crews with four large tractors to the site to assist if needed. And he had a team on notice at BNSF’s headquarters in Fort Worth, Texas. BNSF’s readiness made a difference. At 12:30 p.m. that Saturday, Freeman got a phone call. “They dropped the tube on the tracks,” Freeman recalled a stunned onsite worker saying.1 The crane doing the heavy lifting had collapsed, and the giant tube had fallen directly across all three tracks.2 Three construction workers were injured in the incident.
Freeman and his team immediately flew to the site to help the mine with the response. Given the injuries, the U.S. Mine Safety and Health Administration (MSHA) needed to investigate the accident. The investigators would not arrive until three days later,3 and they had asked that nothing be moved at the site until they completed their investigation. Freeman explained that the delay would affect more than 200 trains, potentially affecting the supply of coal to power plants, and that he had to move the tube as soon as possible. MSHA agreed that BNSF could shift the tube very carefully, as long as it did not disturb any evidence associated with the collapsed crane.
Although moving the huge conveyor tube was daunting, BNSF had experience moving very large objects, such as derailed locomotives and loaded rail cars. Applying that expertise, BNSF accomplished the move in 21 minutes. After shifting the tube, the company found minimal damage to the tracks, and trains were soon running normally that day.4
By detecting the potential threat in advance and developing contingency plans, BNSF had equipment and personnel ready and on the spot. Once the company had gotten permission to move the tube, its staff could do so promptly.
As this example illustrates, detecting the potential for a disruption to your business — ideally before that disruption occurs — can help you reduce its negative impact. (See “About the Research.”) Of course, different disruptions have different degrees of impact, which affects how companies prioritize risk management efforts; a tsunami that drags a factory into the sea is more serious than a shortage of some part. What’s more, different disruptions occur with different frequencies or likelihoods. Adverse weather, for example, occurs more often than major fires or epidemics do.
The Importance of Detection Lead Time
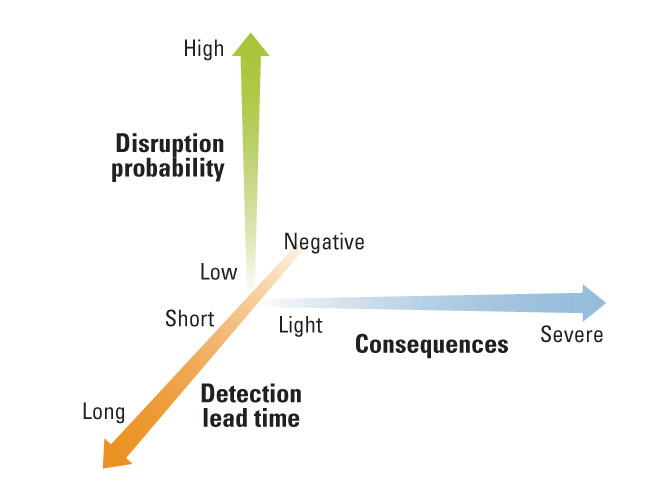
Many risk management experts categorize potential disruptions by two dimensions: likelihood of occurrence and magnitude of impact. (See “Categorizing Potential Disruptions by Likelihood and Impact.”) However, disruptions also vary on a crucial third dimension: their detection lead time. Detection lead time is defined as the lead time between knowing that a disruptive event will take place and the event’s first impact on the company; it is the amount of warning time during which a company can prepare for the disruption and mitigate its effects.
Categorizing Potential Disruptions by Likelihood and Impact
Risk management experts often categorize potential disruptions by two dimensions: likelihood of occurrence and magnitude of impact.

Detection lead time varies widely, depending on the type of disruption and the vigilance of the organization. (See “The Third Dimension of Disruptions: Detection Lead Time.”) Some disruptions involve long-term trends that are widely discussed in the media (for example, aging populations in the Western world, China, and Japan) or are prescheduled events (such as new regulations or labor union contract deadlines), while others (for instance, hurricanes) occur after a short warning of a few days. Other disruptions, such as fires, earthquakes, or power outages, occur without warning but are instantly recognizable — having a detection lead time of zero. Finally, disruptions such as product contaminations or design defects may not be discovered until well after they’ve occurred — a negative detection lead time. Some disruptions, such as industrial espionage or cyberattacks, may never be recognized. Thus, the detection lead time for an event can be positive (if the event is detected or forecast in advance of its impact on the company), zero (if it is detected at the moment it hits the company), or negative (if disruption is not detected until after the event occurs).
The Third Dimension of Disruptions: Detection Lead Time
The detection lead time for an event can be positive (if the event is detected or forecast in advance of its impact on the company), zero (if it is detected at the moment it hits the company), or negative (if disruption is not detected until after the event occurs).
A company can reduce the likelihood of disruptions by being compliant with regulations and responsive to social concerns, maintaining good labor relations, and trying to avoid situations particularly prone to disruptions (for example, suppliers located in flood plains or unstable countries). A company may also implement safety, quality, and security measures,5 including cybersecurity. Yet such preventative measures cannot entirely eliminate risks — and tend to target only the most foreseeable causes of business disruption.
Companies can reduce the impact of a disruption by being prepared to deploy a timely and effective response. Optional assets such as spare inventory, spare capacity, and alternative suppliers provide materials and resources that can be used to minimize impacts and accelerate recovery times. Companies can create emergency operations centers, business continuity plans, and predefined escalation procedures that help coordinate a response. Emergency operations drills and training can improve the response and uncover hidden gaps or vulnerability in systems. Flexible processes can help a company respond quickly and efficiently. Increasing flexibility and adding “just-in-case” assets can increase overall resilience. Yet such preparatory measures won’t be effective unless deployed in a timely manner.
The declining cost and growing use of technology, especially mobile phone technology, expands the opportunities for gathering real-time sensor data to freight-carrying vehicles.
An important element in the effort to mitigate the impacts of most disruptions is quick detection. The earlier the warning of an upcoming or ongoing disruption, the more a company can do in preparation, such as moving inventory and assets away from the affected area, preparing recovery materials, or securing supplies from another source. In many cases of supplier disruptions, the earliest companies to detect the problem have a competitive advantage over less-vigilant competitors in securing limited remaining global supplies or capacity.
In the context of global supply chains, companies may have weeks of detection lead time about supply disruptions if they are alert. A disruption such as an earthquake at a distant supplier or in a deep part of the supply base might hit a company’s supplier instantly, but it may take weeks for the disruption to impact the company itself due to the weeks of materials in transit, work in process, or inventories at intermediate, unaffected links of the chain.
Detecting Disruptions Quickly
Detection depends on timely data about the operating events and environmental phenomena that could impact a company as well as its suppliers, customers, and transportation links. What follows are nine data sources that leading companies use to improve their ability to detect potential disruptions early on.
1. Monitor the Weather
One of the key data sources for the most common types of business disruptions is weather monitoring — with high-resolution data. In an average year in the United States, there are 10,000 severe thunderstorms, 5,000 floods, and 1,000 tornadoes, not to mention about a dozen named tropical storms and nine hurricanes. The U.S. National Weather Service detects and monitors these storms via reams of data from two weather satellites in geosynchronous orbit, 164 Doppler weather radar sites, 1,500 real-time monitoring stations, and the SKYWARN network of nearly 290,000 trained volunteer severe-weather spotters.6 Nor is the U.S. network unique. Each country and region has its own portfolio of weather-data gathering and forecasting resources.
Companies tap into weather data, forecasts, and warnings through a variety of local and national channels. After a surprise blizzard shut down United Parcel Service Inc.’s air freight hub in Louisville, Kentucky, in 1994, the company hired five meteorologists for its global operations center. “Our customers in Barcelona and Beijing don’t care that it snowed in Louisville. They want their packages,” said Mike Mangeot, a UPS Airlines spokesman. “So we felt the need to have a greater read on the weather that was coming.”7
2. Track the News
A variety of local, national, and international news services provide a stream of data on other types of disruptive events such as fires, civil unrest, infrastructure problems, and government actions. Rather than attempt to monitor all possible events worldwide, many companies subscribe to event-monitoring services such as NC4, Anvil, iJet, the U.S. State Department’s Overseas Security Advisory Council (OSAC), or CargoNet. These services collect incident data, analyze the severity, and then relay selected, relevant alerts to their clients. Different services may focus on different types of threats, ranging from travelers’ security (Anvil) to sociopolitical threats (OSAC) to cargo security (CargoNet). Thus, many companies subscribe to more than one service.
In a representative week, a service such as that provided by El Segundo, California-based NC4 Inc. might issue 1,700 alert messages covering 650 events around the world.8 Many events seem quite localized, such as a shooting in a mall in Nebraska, student demonstrations in Colombia, or the crash of a small plane in Mexico City.9 Yet if a company has facilities or suppliers in one of those areas, it could easily be affected by lockdowns, blocked roads, heightened security, or the event itself. Most alert-software tools offer customization, allowing companies to specify alert thresholds for each type of facility in the map of their supply chain, based on event severity and distance from the mapped facility.
3. Use Sensor Data
Another type of data stream comes directly from a company’s own assets. For example, the U.S. drugstore chain Walgreen Co. uses in-store sensors to monitor each of its 8,200 U.S. locations. The raw data flows to the company’s centralized security operations center, which handles the retailer’s safety, security, and emergency response needs. Electrical power sensors alert Walgreen Co. to blackouts, which lets the company quickly take steps such as contacting the power company, dispatching generators, or sending refrigerated trucks to recover perishable inventory. Walgreens stores carry both refrigerated foods and temperature-sensitive pharmaceuticals, so faster detection of a blackout means less spoilage.10
The declining cost and growing use of technology, especially mobile phone technology, expands the opportunities for gathering real-time sensor data to freight-carrying vehicles and even the shipments themselves. For example, Schneider National Inc., a large truckload carrier and logistics company based in Green Bay, Wisconsin, will have GPS/cellular data tracking units on all of its 44,000 intermodal containers and van trailers by the end of 2015. Tracking and communicating with a moving truck fleet leads to higher utilization, increased driver productivity and lifestyle improvements, fuel cost optimization, better customer service, and more accurate billing.11 The same sensors also improve freight security by detecting and tracking stolen trailers.
The Dow Chemical Co. tracks the location of rail tank cars carrying hazardous materials, using GPS trackers with cellular data connections. If a tank car deviates from its expected route or approaches a heavily populated area, Dow’s systems automatically warn the company, which can then alert authorities of any potential danger.12 Dow’s Railcar Shipment Visibility Program is an example of geofencing, which is the creation of a virtual boundary around either a high-value or high-risk mobile asset or a critical geographic area, along with ways of detecting when the item crosses the virtual boundary.
Sensor data can now extend to individual shipments with devices such as Fedex Corp.’s SenseAware, which is a flat, hand-sized device that shippers can slip into any box, pallet, or container. The device contains a battery-powered GPS receiver, a temperature monitor, a pressure monitor, and a light sensor.13 It also contains a cellular data network circuit that can connect to the same networks used by mobile phones. Periodically, the device “phones home” with data about the package’s location and status. With these data, the shipper, carrier, and customer can detect problems with a package while in transit.
These examples are part of a broad trend of the “Internet of Things,” which refers to a growing use of low-cost computing, sensors, wireless data, and Internet connectivity to provide enhanced detection and situational awareness.
4. Monitor the Supply Base
With the general shift from local production and vertical integration strategies to globalization and outsourcing comes the need to monitor a global supply base. Companies concerned about supplier bankruptcies, failures in quality, changes in supplier business strategy, and corporate social responsibility try to detect potential problems through comprehensive supplier monitoring.
To create a list of supplier warning signs on which to collect data, Boston Scientific Corp., a medical solutions company based in Marlborough, Massachusetts, queried its materials employees, manufacturing people, outside contractors, and accounts payable staff — everyone who interacted with the supply base. Managers created a list of 20 warning signs and then trained employees to watch for these signs as they visited or interacted with suppliers.14 Some important signs included failure to prepare timely financial reports, multiple adjustments to annual reports, frequently renegotiated banking covenants, deteriorating working capital ratios, and lengthening accounts payable (or check holding).15
Another option is the monitoring of news aggregation services such as LexisNexis Group’s databases for indicators of business health. For example, the service reported 15,000 news articles mentioning the Eastman Kodak Co. in the two years leading up to the company’s bankruptcy filing in January 2012; those articles increasingly used the terms “insolvency and bankruptcy,” “U.S. Chapter 11 bankruptcy,” “law and legal system,” and “spikes in divestitures” in the final months before Kodak filed for bankruptcy.16
Companies can also watch for operational problems at critical suppliers. These include high employee turnover, especially in key positions; botched acquisitions or failed new product launches; operating losses and lack of capital investments; and so on.17 Companies can monitor operational warning signs such as late or missed deliveries, incomplete shipments, quality issues, and billing and invoicing errors. These may be signs of corner-cutting and layoffs and suggest that the supplier’s management is preoccupied with issues other than customer service and product quality. By monitoring supplier quality carefully, companies can get three to five months’ warning of an impending failure and can take steps either to help the supplier or to find alternative suppliers.18
5. Visit Suppliers
Detection at a distance has its limits. Surveys and third-party data go only so far in detecting incipient disruptions or disruption-prone suppliers. EMC Corp. uses a “trust but verify” approach to detect emerging risks with its suppliers. Trevor Schick, then vice president of global supply chain management and chief procurement officer at EMC, said that the company deploys 50 people in Asia (where it does its manufacturing) to focus on quality and identify red flags early.19 These people visit suppliers, walk the production lines, see the warehouses, and speak to the suppliers’ engineers and factory workers. They use a checklist of warning signs such as quality problems, capacity reductions, stopped lines, and excessive inventory. If a supplier is reluctant to let EMC people in the door, that is a warning sign in itself.
Other companies use similar methods to detect risks in the supply base, but with a focus that depends on the types of risks most salient in their respective industries. For example, in 2009, Ed Rodricks, who at the time was general manager, supply chain at Massachusetts-based Shaw’s Supermarkets Inc., said that the grocer’s field buyers pay attention to food handling and product quality standards when they visit farms and contract manufacturers.20 Fashion retailer The Limited, on the other hand, said it inspected apparel suppliers with an emphasis on working conditions and workplace safety to avoid the use of sweatshops or child labor.21 Ikea, the Swedish furniture giant, employs 80 auditors, performing over 1,000 audits in 2012 at supplier locations, most of which are based on unannounced visits. The audits are focused on environmental sustainability and working conditions.22 As with EMC, refusal to let the auditors in is considered a violation by Ikea, triggering an immediate stoppage of deliveries from the supplier.
6. Be on the Alert for Deception
To monitor the quality of raw materials supplies, many companies use routine laboratory tests to detect low-quality, diluted, or adulterated materials. For example, cow’s milk and wheat gluten are tested for protein levels. But the protein test isn’t perfect, and unscrupulous suppliers can fool the test by adding melamine — an inexpensive industrial chemical used in plastics, insulation, and fire retardants that causes kidney failure if consumed in large amounts. In 2007, thousands of dogs and cats died in the United States from melamine-adulterated gluten used in pet food. In 2008, six infants died and 300,000 were sickened in China as a result of melamine-laced infant formula.23 The episode forced regulators and companies to deploy more expensive tests to detect the protein-mimicking chemical.
Sometimes a supplier’s efforts to elude auditors are simple and crude. Ikea’s sustainability compliance auditor, Kelly Deng, has seven years’ experience, and the typical auditor in her office has been on the job for five years.24 The experience helps her spot telltale signs of violations during her visits — such as a worker hurrying by with a stack of papers. Factory managers may falsify records, she said, and send a worker to take the accurate records out of the building. Thus, companies may want to collect deeper data on the potential quality of disruption-related data — ensuring that suppliers are not sugarcoating data on their status, material quality, or operations integrity.
7. Develop Traceability Capabilities
Not all disruptions are as visible or instantly news-making as an earthquake or tornado. Some disruptions lurk in the complexities of the materials, components, people, companies, and interactions inherent in supply chains. Events such as product design defects, manufacturing errors, and contamination can create delayed consequences in product performance. In such cases, the effects of the defect may not be readily apparent until the product reaches customers’ hands and is put into use for some time. Such events spawn after-the-fact disruptions, which means the detection lead time is negative.
The impact of a defective part or product grows worse with each added day. The higher the level of inventory spread across the supply chain when a defect is finally caught, the more defective units must be scrapped, returned, replaced, or reworked. Conversely, the lower the inventories on the shelves of stores and warehouses, the lower the total costs of sending them back and repairing the defect. Thus, make-to-order, postponement, and just-in-time schemes reduce the consequences of late detection of problems in a finished product.
In August 2004, a German clay mine sent a load of marly clay to a McCain Foods’ potato processing plant in the Netherlands. Unbeknownst to either the clay company or the French fry giant, the clay was contaminated with dioxin. McCain’s plant made a watery slurry with the clay and used it to separate low-quality potatoes (which float in the muddy mixture) from denser, high-quality potatoes. Although the dioxin did not contaminate the processed potatoes, it did contaminate the potato peels that were converted into animal feed.
Not until October did a routine test of milk at a Dutch farm reveal high levels of dioxin. Initially, the authorities suspected a faulty furnace as the cause, but further investigation uncovered the true cause as a “potato industry by-product [that] had been contaminated by marly clay used in the washing and sorting process.”25 By the time authorities traced the source of the dioxin, contaminated potato peels had been fed to animals at more than 200 farms. Fortunately, the EU’s food traceability rules include a “one step forward and one step back” provision for all human food and animal feed companies. That capability enabled authorities to trace all the customers of the tainted peels to animal food processors in the Netherlands, Belgium, France, and Germany and to the farms that may have received the poisonous peels. Rapid detection and tracing in both directions prevented any dioxin-tainted milk from reaching consumers, although some farmers were forced to destroy milk or animals.26
8. Monitor Social Media
Six billion people (out of the estimated 7 billion people in the world in 2013) have access to a mobile phone. In addition, more than 2 billion people in 2014 used social media such as Twitter, Facebook, Instagram, or other country-specific services. Reflecting this, the United States Geological Survey now monitors Twitter to detect earthquakes. “In some cases, it gives us a heads-up that it happened before it can be detected by a seismic wave,” said Paul Earle, a seismologist with the U.S. Geological Survey. Once a natural disaster occurs, social media channels can provide an informal, real-time damage assessment because the local population will naturally talk about what they felt, what they saw, and the problems in their location.27
Twitter Incident Management, or Twitcident, is a broader monitoring system that analyzes Twitter’s social media data stream to detect and monitor disruptive events such as fires, extreme weather, explosions, terrorist attacks, and industrial emergencies.28 A collaboration between the Delft University of Technology, the Netherlands Organisation for Applied Scientific Management TNO, and CrowdSense,29 it uses semantic analysis of messages and real-time filtering to automatically extract relevant information about incidents. The initial system is intended to help first responders, but it could be adapted for commercial use.
Once a natural disaster occurs, social media channels can provide an informal, real-time damage assessment because the local population will naturally talk about what they felt.
In addition to providing data on geographic disasters, social media provides data on looming disruptions to a company’s reputation. Dell Inc. created its Social Media Listening Command Center as a means to detect and respond to problems big and small. The computer maker uses this “listening and responding” program for customer service and support, community building, and topical discussions. Every day, thousands of Dell customers use Twitter, Facebook, and Dell.com for routine product support. The company monitors message trends to detect problems such as product defects, negative public relations drives, or an adverse shift in customers’ attitudes toward Dell and its products. The company tracked 22,000 mentions of Dell each day in 2010, when the command center opened. “When you are embedding social media as a tool across virtually every aspect of the company to be used by employees as one of the ways they stay in touch with customers every day, it simply becomes part of how we do business,” said Manish Mehta, then Dell’s vice president for social media and community, in 2011.30
9. Track Regulatory Developments
Changes in government policies affect companies’ cost structures, siting decisions, and compliance challenges. Lead time for government regulations varies and can be quite long. For example, the U.S. Securities and Exchange Commission now requires certain public disclosures by publicly held companies relating to conflict minerals used in their products. (Conflict minerals include tin, tantalum, tungsten, and gold that militia groups, notably in the Democratic Republic of the Congo, benefit from, using slave labor to mine them and selling the minerals to fund armed conflict.) Companies had at least a year to prepare for the new S.E.C. regulations about conflict minerals.
However, other government actions can hit with little or no warning. When the United States raised import duties on certain Chinese-manufactured tires from 4% by an additional 35% in September 2009, it did so with only 15 days’ notice. Tires that left Chinese ports in early September became one-third more expensive during the long boat ride across the Pacific. Similarly, when the Chinese cut exports of rare earths in late December 2011, the new limits applied almost immediately.31
Government policies affect a wide range of corporate affairs such as financial reporting, taxation, human resources, workplace safety, product requirements, environmental emissions, and facilities. The job of collecting data on relevant regulatory changes often falls under a centralized corporate function such as legal, compliance, or enterprise risk management.32
Four Steps to More Effective Detection
Data on disruptive events may be necessary to detection, but it’s not sufficient. When employees of Cisco Systems Inc., based in San Jose, California, saw news of wildfires in Colorado in 2012, they weren’t initially concerned, because the IT company had no manufacturing or suppliers in the area. What the company missed, however, was that the fire impacted one of the company’s call centers.33 Detection faces a classic trade-off between two types of detection-error risks. On one hand, an undersensitive system can miss or be too late to recognize important disruptions, incurring avoidable damage. On the other hand, an oversensitive detection system can generate false alarms to benign events too often, squandering response resources and engendering “cry-wolf” distrust among responders.
Four detection management tasks help companies know which events to watch out for and react to on a timely basis.
Mapping the facilities of the company and its suppliers is a prerequisite to collecting the right data for detecting events linked to many common causes of disruption.
Map the Supply Chain
Weather, earthquakes, social unrest, electrical blackouts, and government regulations all have strong geographic elements. Mapping the facilities of the company and its suppliers is a prerequisite to collecting the right data for detecting events linked to many common causes of disruption. Companies such as Cisco determine the locations of their key (Tier 1) suppliers to assess supplier risks. Such location data then feeds into the incident-monitoring systems that the companies use.
Conflict minerals regulations and traceability regulations are pushing more companies toward mapping at least some parts of their supply chains to greater depths — mapping suppliers of suppliers, too. For example, San Jose, California-based Flextronics International Ltd. (recently renamed Flex) and many other electronics companies have been using a template developed by the Electronic Industry Citizenship Coalition and the Global e-Sustainability Initiative for reporting the use of conflict minerals as well as suppliers’ due diligence on tracing the sourcing of conflict minerals. That template essentially encourages each supplier to encourage its own suppliers to fill out the template, too, cascading the analysis all the way to the smelter level and beyond.34
Mapping supply chains — particularly their deeper tiers — remains a challenge because of the dynamic nature of supply chains and the proprietary nature of each supplier’s relationships with its partners. Moreover, as more companies attempt to map their supply chains, suppliers face administrative costs associated with responding to multiple requests for information.
Resilinc Corp., based in Miltipas, California, exemplifies a new generation of supply chain software, and it services companies addressing these mapping issues. Resilinc surveys a client company’s suppliers to map them and keeps suppliers’ data secure. The surveys cover risk management issues including supplier facility locations, subsupplier locations, business continuity planning, recovery times, emergency contact data, and conflict minerals. Resilinc uses the client’s bill-of-material and value-at-risk data to cross-reference purchased parts with mapped locations and identify high-risk parts. The software uses data on the locations producing each part, the parts in each product, and the financial contributions of each product to estimate the value-at-risk associated with each supplier location.35
Other companies offering mapping and detection software (and related consulting services) include Razient of Miami, Florida, and MetricStream of Palo Alto, California. Several companies providing supply chain event management applications — including Trade Merit, CDC Software, and Manhattan Associates — have also geared their offerings to risk management.36 In addition, many consulting organizations have developed supply chain risk management practices, assisting companies in assessing risks and developing prevention and mitigation measures.
Some companies, such as IBM and Cisco, have created in-house supplier mapping applications.37 However, third-party services such as Resilinc and its competitors reduce the costs of supplier mapping and updating because they gather their information primarily through suppliers’ questionnaires. Thus, once a supplier fills out a questionnaire, the anonymized information can be used for other customers of that supplier, since most suppliers serve multiple industry players. Such a “network effect” reduces the administrative costs of information collection as well as the suppliers’ compliance efforts.
Assess Global Events
Companies rely on a wide range of monitoring activities to detect potential disruptions. The goal of the monitoring is “situational awareness” — relevant and timely data that reflects risk conditions that might affect the company and its decisions. For companies with global supply chains, this implies monitoring global events. Although monitoring the entire world for any of dozens of kinds of potential disruptions seems like a daunting task, companies can rely on automated software and devices as well as event-monitoring service companies such as NC4 and its competitors. To minimize the time from alert to response, companies rely on special-purpose monitoring services that convert the flood of raw data into relevant alerts and warnings.
For example, to support real-time response, Resilinc scans several event data sources for potential disruptions. If an event potentially affects a supplier and thus one or more of its clients’ companies, Resilinc determines which parts and products may be affected as well as the potential value-at-risk and sends an alert about the event to each affected company. During the 2011 Thailand floods, Resilinc helped Flextronics gain about a week’s warning regarding the threat posed by the rising waters.38
Data about potential disruptions then need to feed into some sort of incident management process or system. For example, to manage disruptive events, Cisco uses a six-step incident management life cycle: monitor, assess, activate, manage, resolve, and recover. The company does not try to predict incidents — an impossible task — but focuses on monitoring and early response instead, according to Nghi Luu, senior manager, supply chain risk management at Cisco. Cisco built an incident management dashboard to detect potential disruptions to the products that make up the majority of the company’s revenues. The development cost of the dashboard was in the low five figures, and Cisco’s investment has been paid back many times over, according to Stanford, Connecticut-based research firm Gartner Inc.39
Cisco uses the event-monitoring company NC4 and overlays event data on a Google Earth map to visually highlight its own (and suppliers’) locations that are within affected areas. Cisco incident management team members can view events on the map or as a list, and they can assign events to an incident watch list to indicate their severity, status, and potential quarterly revenue impact. Cisco also taps “informal” sources to detect developing problems, including in-country personnel in its global manufacturing organization and what it calls “lots of feelers.”40 In many cases, relationships between engineers in trading partners may bring up issues that managers are not ready to discuss or are even not yet aware of.41
Companies including Walmart, Intel, and Cisco have noted that multiple functional groups in their organizations share incident-monitoring data feeds. The supply chain group might watch for incidents affecting the company’s facilities, logistics channels, and suppliers. At the same time, HR might watch the incident feeds for events that might jeopardize the safety of any employees who are posted or traveling abroad. Finally, corporate finance might monitor the feed for events that affect financial matters, such as exchange rates and credit ratings.
To manage disruptive events, Cisco uses a six-step incident management life cycle: monitor, assess, activate, manage, resolve, and recover.
Create Supply Chain Control Towers
Airport control towers — with their all-weather ability to choreograph the intertwining movements of aircraft on the ground and in the air — provide a natural model for managing supply chains. A supply chain control tower is a central hub of technology, people, and processes that captures and uses supply chain data to enable better short- and long-term decision making. “You can respond much more quickly when your people, technology, and systems are in a single location,” said Paul McDonald of logistics management company Menlo Worldwide LLC, based in San Francisco.42
In 2009, Unilever established an internal organization, UltraLogistik, to operate as a control tower based in Poland to manage all Unilever transport movements in Europe. Centralizing all transportation procurement and operations (using Oracle’s transport management system) yielded cost savings, reduced carbon footprint, and increased visibility. That increased visibility translates into quick detection of problems.43
Although a supply chain control tower primarily serves day-to-day operations, it sits on the front line for detecting disruptions, handling incidents, and coordinating responses.44 In that capacity, the control tower is similar to a full-time emergency operations center in that its staff can be the first to notice telltale signs of looming significant disruptions, such as unexpected supplier component shortages, problems in the flow of items (such as port closures or customs worker strikes), and accidents.45 It can then respond by rerouting flows, notifying customers, informing company facilities, and so forth.
Improve Response Times Through Data and Analysis
Fast detection gives companies time to prepare for a disruption or to mitigate its consequences. To accelerate detection, companies can collect data more often and from closer to the cause of the disruption. Some supply chain risk services companies are using data mining to predict disruptions even before they happen. For example, New Jersey-based Verisk Analytics Inc. uses data science to find possible correlations between various incidents and impending geopolitical events that may disrupt businesses.46
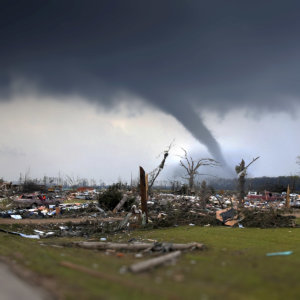
In mid-April 2012, a massive low-pressure system formed over the central Plains of the United States. Its strength prompted the NOAA/National Weather Service’s Storm Prediction Center to issue an unusual multiday advance warning. It predicted a 60% chance of severe weather for north-central Oklahoma and south-central Kansas for the afternoon and evening of Friday, April 13.
Trains and tornados don’t mix, and BNSF Railway has thousands of miles of track crisscrossing “Tornado Alley” in the central states of the United States. BNSF subscribes to AccuWeather, a company based in State College, Pennsylvania, that detects, tracks, forecasts, and warns its clients of impending severe weather. AccuWeather uses data from advanced high-resolution Doppler radars to help spot tornados accurately and quickly. On that day in April 2012, AccuWeather detected the likely formation of a tornado in Norman, Oklahoma, 30 minutes before it touched the ground. Using data on prevailing winds and models for tornado behavior, the AccuWeather forecast the likely trajectory of the twister and warned BNSF that a tornado might cross its tracks in Norman sometime between 3:50 p.m. and 4:30 p.m. By the time the tornado thundered across BNSF’s tracks at about 4:10 p.m., the railroad had had 40 minutes to clear the area of trains.47
Forewarned Is Forearmed
Detection is a broader and deeper strategy than watching CNN, monitoring social media, or installing smoke detectors. Detection means vigilance on both specific near-term events and potential future events that might disrupt the company. It depends on creating visibility into the supply chain and understanding how the global moving parts connect to each other and impact each other. At its heart, detection is the conversion of the relevant unknowns into salient knowns in a timely fashion. Using insights gained from detecting potential disruptions early, companies can respond to such threats effectively — and exhibit the power of resilience.
References
1. David L. Freeman (vice president of engineering, BNSF Railway), in discussion with the author, July 24, 2013.
2. D. Bleizeffer, “Three Injured, Two Critically, in Black Thunder Crane Accident,” Casper Star-Tribune, May 31, 2008.
3. David L. Freeman, discussion with the author.
4. Ibid.
5. For a discussion of such approaches, see Y. Sheffi, “The Resilient Enterprise: Overcoming Vulnerability for Competitive Advantage” (Cambridge, Massachusetts: MIT Press, 2005).
6. See “About,” n.d., http://skywarn.org; “Frequently Asked Questions,” June 1, 2015, www.aoml.noaa.gov; “Weather Radar: NWA Remote Sensing Committee,” January 16, 2015, www.nwas.org; and “NOAA Weather Stations: Determining Global Temperature,” n.d., www.noaa.gov.
7. A. Pawlowski, “UPS, FedEx Meteorologists Get Your Packages to You on Time,” December 20, 2012, www.today.com; and “UPS Meterologists Use the Latest Technology to Ensure On-Time Delivery,” n.d., http://thenewlogistics.ups.com.
8. NC4, “6/13/11-6/19/11 Significant Alerts by Category,” 2012, https://web.archive.org.
9. NC4, “NC4 Incident Monitoring Center Featured Incidents,” 2012, https://web.archive.org.
10. ESi Acquisition and SunGard, “Walgreens Gains Real-Time Awareness of More Than 8,000 Stores,” accessed November 3, 2013, http://www.esi911.com (site discontinued).
11. T. Berg, “Schneider Begins Installing Container- and Trailer-Tracking Devices,” June 28, 2013, www.automotive-fleet.com.
12. W.H. Tate and M.D. Abkowitz, “Emerging Technologies Applicable to Hazardous Materials Transportation Safety and Security,” Hazardous Materials Cooperative Research Program Report 4 (Washington, D.C.: Transportation Research Board, 2011); and J.C. Casto, “Web-Based Solution for Monitoring the Location, Security, and Status of Hazardous Material Movements” (presentation at the RFID Journal Live! Tenth Annual Conference and Exhibition, Orlando, Florida, April 3-5, 2012).
13. “What Is SenseAware?,” n.d., www.senseaware.com.
14. M. Kalfopoulos, “Panel Discussion” (presentation at the MIT Center for Transportation and Logistics Crossroads Conference, Cambridge, Massachusetts, March 26, 2009).
15. K. Philip, “Companies Exhibit Early Warning Signs of Trouble; Early Action May Stem Losses, Save Businesses,” Dec. 1, 2006, www.turnaround.org.
16. J. Ritchie and O. Akoto, “Spotting the Early Warning Signs of a Company’s Impending Financial Collapse,” white paper, LexisNexis and State of Flux, n.p., August 2012.
17. Philip, “Companies Exhibit Early Warning Signs.”
18. Company representative, “Panel Discussion” (presentation at the MIT Center for Transportation and Logistics’ Advancing Supply Chain Risk Management: Emerging Challenges and Strategies symposium, Cambridge, Massachusetts, October 10, 2012). Names of participants at MIT Center for Transportation and Logistics partner-only events are available only to partners.
19. T. Schick, “Panel Discussion” (presentation at the MIT Center for Transportation and Logistics Crossroads Conference, Cambridge, Massachusetts, March 26, 2009).
20. E. Rodricks, “Panel Discussion” (presentation at the MIT Center for Transportation and Logistics Crossroads Conference, Cambridge, Massachusetts, March 26, 2009).
21. Company representative, “Panel Discussion” (presentation at the MIT Center for Transportation and Logistics’ Advancing Supply Chain Risk Management: Emerging Challenges and Strategies symposium, Cambridge, Massachusetts, March 26, 2009). Names of participants at MIT Center for Transportation and Logistics partner-only events are available only to partners.
22. “IWAY or How We Support Our Suppliers and Their Suppliers,” February 24, 2014, http://lifeathome.ch/en.
23. “U.N. Panel Sets Limits for Chemical Melamine in Infant Milk Following 2008 China Scandal,” July 5, 2012, www.cbsnews.com.
24. Kelly Deng (sustainability compliance auditor, Ikea), in discussion with Alexis Bateman of the MIT Responsible Supply Chain Lab, December 12, 2013.
25. “Dioxin Scare Shuts Farms,” November 12, 2004, www.fwi.co.uk.
26. See B.M.J. van der Meulen and A.A. Freriks, “Millefeuille: The Emergence of a Multi-Layered Controls System in the European Food Sector,” Utrecht Law Review 2, no. 1 (June 2006): 156-176; “Dioxin Scare Shuts Farms,” November 12, 2004, www.fwi.co.uk; and “Dioxin in Kaolinitic Clay,” Food Safety Authority of Ireland News 6, no. 6 (November-December 2004).
27. Y. Wang, “More People Have Cell Phones Than Toilets, U.N. Study Shows,” March 25, 2013, http://newsfeed.time.com; “Digital, Social, and Mobile Worldwide in 2015,” January 21, 2015, http://wearesocial.net; and D. MacMillan, “Twitter Alerts U.S. Geological Survey to Philippines Quake,” August 31, 2012, www.bloomberg.com.
28. P. Marks, “Twitcident Searches Tweets to Help Emergency Services,” April 13, 2012, www.newscientist.com.
29. “Researching Technology for Mining Social Media in Times of Crises,” n.d., http://wis.ewi.tudelft.nl.
30. D. Strom, “Listen Up! Dell Lends Its Ear to Social Media,” February 23, 2011, www.cmo.com; “How Dell Has Reinvented Itself Thanks to Social Media,” blog post, May 15, 2012, http://socialaxis.wordpress.com; and L. Menchaca, “Dell’s Next Step: The Social Media Listening Command Center,” December 8, 2010, http://en.community.dell.com.
31. The White House, Office of the Press Secretary, “Proclamation Address Market Disruption From Imports of Certain Passenger Vehicle and Light Truck Tires,” September 11, 2009, whitehouse.gov; and Associated Press, “China Announces Another Massive Cut in Rare Earth Exports,” December 28, 2011, www.businessinsider.com.
32. See “Costs Associated With Regulatory Risks,” December 31, 2008, http://erm.ncsu.edu.
33. N. Luu, “Business Continuity Management and Crisis Management” (presentation at the MIT Center for Transportation and Logistics Advancing Supply Chain Risk Management: Emerging Challenges and Strategies Conference, Cambridge, Massachusetts, Oct. 10, 2012).
34. See “Conflict Materials Reporting Template,” n.d., www.conflictfreesourcing.org.
35. Bindiya Vikal (CEO and founder, Resilinc), in discussion with the author, December 26, 2013.
36. Y. Sheffi, B. Vakil, and T. Griffin, “New Software Tools to Manage Risk and Disruptions: Part II,” March 29, 2012, www.scmr.com.
37. Ibid.
38. Y. Sheffi, B. Vakil, and T. Griffin, “Risks and Disruptions: New Software Tools,” unpublished ms.
39. N. Luu, “Business Continuity Management and Crisis Management.”
40. Ibid.
41. C. Bolgar, “Boosting Protection,” May 10, 2010, www.supplychainriskinsights.com.
42. D. Biederman, “‘Control Towers’ Gain Scale Among 3PLs,” Journal of Commerce, June 10, 2013; and “Global Supply Chain Control Towers: Achieving End-to-End Supply Chain Visibility,” June 8, 2011, www.capgemini.com.
43. Stella Constantatos (global sustainability manager for supply chain, Unilever), in discussion with the author, February 20, 2013.
44. G. Johnsen, “Your Global Supply Chain Control Tower Has a Memory,” February 25, 2010, www.scdigest.com; and R. Strollo, “The Rise of Global Control Towers,” June 1, 2014, www.logasiamag.com.
45. “Order Out of Chaos: The Case for Building a Frontline Supply Chain Control Tower,” 2011, www.e2open.com.
46. “Versik Analytics Fact Sheet,” n.d., www.verisk.com.
47. See Storm Prediction Center, NOAA/National Weather Service, “April 13, 2012 0600 UTC Day 2 Convective Outlook,” April 13, 2012, www.spc.noaa.gov; OUN Webmaster, “The April 13, 2012 Norman, Oklahoma Tornado,” n.d., www.srh.noaa.gov; and “Advanced, Site-Specific Warnings Aid Preparations,” n.d., http://enterprisesolutions.accuweather.com.
Comment (1)
Rabindranath Bhattacharya