Reading Global Clients’ Signals
By taking a big data approach to analyzing collaborations with large clients, highly distributed global companies can gain valuable and timely insights into client satisfaction.

Keeping tabs on the health of client relationships is an important activity for any company hoping to promote stability and growth. Knowing how customers feel about your products and services is particularly vital for organizations specializing in “extended-enterprise” services such as back office operations, decision support, and engineering, technology and asset support for large operations. In the last 20 years, the popularity of such so-called “shared services centers,” those shared either internally or externally through outsourcing, has grown exponentially. Shared services centers now employ hundreds of thousands of people worldwide and constitute a ubiquitous backbone across the largest and most complex enterprises. Although this organizational model has created significant economic benefits and is a cornerstone of organizational scalability and cost effectiveness, it also presents significant governance challenges: The large-scale, global nature of the service delivery and the complex, often matrixed client organizations such companies serve make it harder to detect client dissatisfaction.
Many companies monitor customer satisfaction through customer satisfaction surveys such as the Net Promoter Score pioneered by management consultant Bain & Co. An NPS score is obtained by (1) asking customers to answer a single question (“How likely is it that you would recommend our company to a friend or colleague?”) on a scale from 0 to 10 (where 10 is “extremely likely” and 0 is “not at all likely”); and (2) subtracting the percentage of “detractors” (scores 0-6) from the percentage of “promoters” (scores 9-10).1 However, such methods are not necessarily timely (because they are survey-based) and often do not enable companies to drill down into detail (because of the size of the sample). Therefore, they are not sufficient for continuous measurement of customer satisfaction or for informing timely and targeted corrective actions.
As it turns out, there are two specific challenges to behavior analysis in global organizations such as shared services centers. The impersonal, remote nature of many of the exchanges and the high volume of interactions make it extremely difficult for senior management to document and analyze them using traditional means.
Impersonal Interactions
The way people interact with each other and what they say to each other offer an important window into how they feel about each other. However, the content of what is said is often less significant than how it is said and the accompanying body language. Although face-to-face meetings between providers and customers may offer the clearest and most comprehensive way for managers to obtain “honest signals”2 to gauge customer satisfaction, such person-specific information is not generally available in high-volume, globalized collaborations. Nor is this fundamental limitation likely to change, given the growth of global service delivery.
Volume of Interactions
Large global organizations tend to operate through extensive networks involving remote interactions that are mostly phone- and email-based. However, such interactions do contain important information about how well team members get along with each other, employee satisfaction and client satisfaction. To gain insights from such interactions, we have developed an assessment method to analyze email communication patterns between customers and vendors in geographically distributed environments where face-to-face meetings are impractical or impossible. Our approach connects the results obtained from measuring honest signals in face-to-face interactions3 to the data drawn from emails between customers and vendors. (To protect individuals’ privacy, in our email analysis we analyze only [1] the social network structure as it is represented by email communication patterns and [2] the sentiments expressed in the subject lines of emails sent — not the content of the main text of the emails.)
This article describes how we analyze email to understand what customers think about their service providers. In conducting the research, we analyzed the email interactions of 32 service delivery organizations; all are part of Genpact, a global services provider. The delivery organizations were providing procurement, accounting and human resources services to different clients. After notifying the various parties involved and obtaining permissions, we retrieved the email communications between the service provider’s account managers and their customers and constructed the social network from the email archive. The network consisted of all of the email addresses of the employees of the organization and the customers they worked with, with links between two people if they had exchanged at least one email message. The network consisted of more than 200,000 people, encompassing 1.3 million email messages. In all, we collected data from dozens of groups and thousands of people. (See “About the Research.”)
Genpact had used the Net Promoter Score for several years as its primary metric for measuring customer satisfaction and relied on it as a key metric in shaping its relationship with global clients in matters related to incentives and to direct Lean/Six-Sigma optimization interventions; we were thus able to correlate our findings with Genpact’s NPS metrics. Calculating structural properties such as the density of the email networks and successfully correlating them with external metrics provides a helpful indication of the efficacy of the collaborations and provides suggestions for improving organizational performance. The process involves four basic steps: (1) filtering email data to identify the most relevant people; (2) loading social network data into a data set; (3) performing a social network analysis to determine the relationships; and (4) generating network-based scores indicating performance.
Our analysis identified five structural metrics that related to social networks and statistically predicted the satisfaction of the organization’s clients based on emails exchanged between clients and employees of the organization: (1) the centrality of team leadership; (2) team leadership consistency; (3) the pattern of contribution; (4) response time; and (5) the emotional content of language used in emails. Because the contexts and particulars will be different at different organizations, the specific variables may have to be recalibrated. In this case, each of the metrics was devised to capture a different aspect of the relationship between the service provider and the customer. (See “Social Network Metrics for Customer Satisfaction.”) The metric for customer satisfaction used was NPS, since that was the metric Genpact used for that purpose; in other situations, it may be appropriate to use another metric. For example, in an earlier project we used a satisfaction survey we developed,4 and in other projects email social network structure was compared with consultant utilization5 or billable revenue.6
Social Network Metrics for Customer Satisfaction
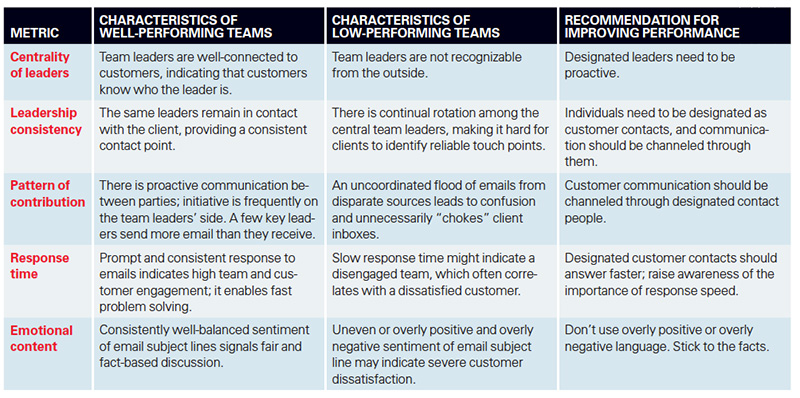
1. Centrality of Leaders
This metric measures the extent to which there are individuals who maintain a relatively high degree of social influence in their teams over extended time periods. In our analysis of email records, we studied the connections between individuals; a connection between a pair of nodes indicates that two people have exchanged at least one email. The shorter the connecting line, the more emails the two people exchanged. When the leadership of the social network is highly centralized, the leaders are clearly recognizable. In practice, such leaders tend to dominate the social interaction network. Social networks without such leaders are less organized. (See “The Influence of Leaders.”)
The Influence of Leaders
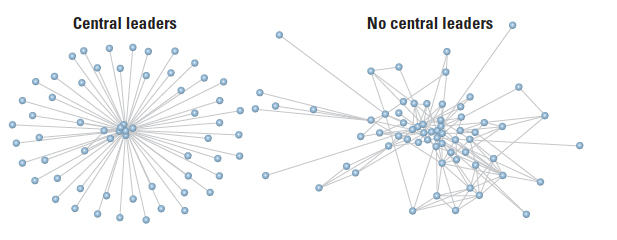
In the context of shared services providers, we found that centralized leadership correlated with customer satisfaction. Central leaders tended to be either senior account executives or self-appointed functional leaders. This corresponds to the view that strong, consistent team leaders will increase the quality of work produced by the team. The leaders are the main “touch points” for the customers, thus providing a reliable way for clients to access different teams, departments and functional units within the service provider. Having central leaders ensures that client requests are swiftly and clearly routed to the provider, and that the responses and corrective actions are communicated back and implemented unambiguously and at scale. Because leaders are intimately aware of the organizational (and often contractual) key performance indicators, they are also the key to ensuring that output is in line with desired deliverables. Finally, the central leaders are typically experienced executives who understand the need for adherence to standard operating procedures and are able to navigate the network to ensure that work is managed in a consistent and predictable way. These elements are well-understood drivers of satisfaction in collaborations of task-driven global organizations.
2. Leadership Consistency
This metric reflects changes in the leadership of the social network over time. At the organization we studied, steady leadership that didn’t change much appeared to contribute to customer satisfaction. This finding contrasts with earlier research on creativity among open-source programmers7 and the marketing employees of a German bank8; that research found that, in those contexts, a high degree of rotating leadership correlated with success. For account management at large service providers, the opposite was desirable. For work that is relatively routine (as opposed to creative work), consistent behavior and disciplined, predictable delivery may be more important to customers than different points of view and contributions; this has been verified in other settings where consistent behavior is valued over creativity, such as with nurses in a hospital. In general, consistent, replicable behavior of leaders plays a crucial role to create organizational trust.9 For the same reasons described in the previous section with regard to the centrality of leaders, some clients may value working with teams that have consistent and reliable leaders and “no surprises.”
3. Pattern of Contribution
This metric captures the extent to which individuals in the network send more emails than they receive, or receive more emails than they send. An individual who only sends emails would have a contribution index of +1; an individual who only receives emails would have a contribution index of -1.10 The contribution index reflects how much the pattern of contribution varies across the social network and across different categories of individuals. For example, people who act as expeditors or communicators send more emails than they receive, while people serving as subject-matter experts receive more emails than they send. Senior managers tend to be balanced in the number of emails they send and receive, while people acting as bottlenecks usually receive many emails but send few and respond infrequently. (See “Communication Patterns Vary.”)
Communication Patterns Vary

Significant variation in the contribution indexes among different people in the organization can correlate with high client satisfaction. This corresponds to clients’ intuitive preferences regarding email communications. In social networks with a high variance in contributions, a few people tend to dominate the discussion, with a subset of people sending far more emails than they receive; another subset will receive far more emails than they send. If clients are the individuals who receive far more emails than they send, the network will satisfy their preferences to receive fewer emails and to receive these emails from a few designated contacts (rather than from many sources within the vendor’s organization). In large, task-oriented global organizations, roles follow formal standard operating procedures, and hence the pattern of contribution of many players is well-defined and unlikely to change in normal situations. When such fluctuations occur, they may very well indicate sudden alterations of standard work patterns — hence signaling a potential problem. The finding also indicates that service providers should be aware of whom they communicate with inside the customer organization and should be disciplined about routing their communications through the appropriate channels.
4. Response Time
This metric measures the average time it takes for individuals to respond to incoming emails. Previous work studying employee satisfaction at two medium-sized consulting businesses in Europe found that low average response time to emails correlates with employee happiness11 and high-quality work.12 We found a similar pattern with customers, where low average response times by customers or service provider employees correlate positively with customer satisfaction. Previous observations have noted that people tend to respond faster to emails from people they like. Therefore, a low average response time for customers responding to their service team may indicate that the customer is happy with their team. A team with a lower average response time is also able to communicate faster and respond to a client faster. Previous research has also found that it is often more productive to send a larger number of short emails rapidly than to carefully compose long and complicated emails.13 Sending short emails more rapidly typically speeds up response time.
We have found that simply alerting people to this expectation can trigger dramatic changes in the speed of response. On the other hand, if the response time of previously fast responders begins to lag, something may be wrong and warrant further investigation. In global, task-oriented large service organizations, speed of response might also indicate that the answer is part of a well-documented set of procedures, provided that it doesn’t necessitate multiple unwarranted iterations. Lengthy response times might indicate that one of the parties is struggling to find an answer, which might indicate what is called an “exception” or a potential defect. These are often suboptimal circumstances that organizations try to minimize, and their emergence might indeed be correlated with client dissatisfaction.
5. Emotional Content of Language
We measured the emotional content of the email headers’ language using a context-specific keyword list of positive words (such as “great” or “wonderful”) and negative words (such as “bad” or “awful”) generated using machine-learning algorithms. Due to privacy concerns, we did not examine the body of the emails — only the subject lines.
A low degree of emotionality in the language in email subject headers correlated with customer satisfaction. The less emotion in emails (in other words, the fewer emotional words used), the more satisfied customers were. The recommendation for providers of services is straightforward: Refrain from using superlatives and overly positive or negative words, and stick to the facts when engaging in direct email communication with customers. Again, in task-oriented, large-scale global organizations, the nature of interaction is often factual and stable; changes to this pattern may well point to underlying issues that start flaring in the language in emails’ headers.
Putting the Methodology to Work
Compared with other approaches for measuring customer relationship and team performance, we believe our method has five distinct advantages: (1) data collection is fast and easy; (2) it allows for near-real-time and detailed assessments of performance and status; (3) it can be pursued without accessing the details of private communications; (4) it has less cultural bias; and (5) it is based on hard metrics rather than perceptions.
Fast and Easy Data Collection
The data collection does not require customer executives to answer questionnaires; it is based on information that already exists and is readily available. This is particularly important given the challenges of collecting survey data. When customers are reluctant to complete surveys, return rates suffer, which can lead to selection biases, as more positively inclined customers might be more likely to answer the survey. Our approach avoids this problem, since it does not require additional action on the part of customers.
Near-Real-Time and Granular Assessments
The method enables rapid assessments of performance and client satisfaction. Without that, management would only get feedback “after the fact” — for example, when a customer refuses to renew the contract. The speed of any method is limited by its required data collection: No assessment can be made until the required data are collected. Methods such as NPS require distributing surveys to customers and collecting the results.
Using email communication as a data source eliminates the delay. Email can be collected on an ongoing basis and analyzed in near real time, permitting management to get regular updates on the status of customer relationships. Additionally, the social network analysis enables management to pinpoint specific groups or individuals who may experience issues — or who may know of issues that have not surfaced yet. In very large organizations, this capability is critical, as it allows for analysis and resolution of problems that may be fixed if addressed promptly.
Protects Private Email Content
Assessment methods that require extensive analysis of the content of communications can be problematic. For example, employees may be concerned that their employers are spying on their emails. With the method presented here, the subject line of the communication is sufficient to analyze the sentiment; viewing the content of messages is unnecessary. And if we do not get the subject line, we have found that examining the network structure (for example, leadership consistency, response time, etc.) provides an early warning system for problems in the health of a customer relationship.
Limits Subject Bias
The method described here is less biased than traditional methods. In assessment methods that rely on customer surveys, data collection requires separate conscious and purposeful behavior on the part of the individuals; they must take the time to fill out and return their surveys. As a result, individuals may introduce bias. For example, in Japanese culture, giving negative responses is considered rude. Therefore, results from surveys filled out by Japanese customers may be biased toward a more positive response.
Our method relies on actual data from emails; no additional involvement is necessary from individuals, thus limiting the opportunity for the subjects to introduce cultural bias. (Although email usage might still differ between different companies and regions, recalibrating the system can alleviate bias.) It is true that there will always be cultural bias on an individual and local level, but our approach to analyzing email structure has shown considerable robustness across different countries and companies.
Based on Hard Metrics
In contrast to the measures produced by traditional methods derived from directed, structured questions, the concrete measures we developed are based on the hard data of communication records and statistics from social network analysis.
Although we have focused on relationships between vendors or service providers and their clients, similar assessment methods can be applied in a wide variety of contexts, including high-tech consultants working with large clients,14 research teams developing new high-tech solutions or medical applications,15 and bank employees serving customers.16 As long as the communication archives of staff members and other supply chain participants are readily available, the approach is well suited to measuring and enhancing the effectiveness of knowledge workers.
However, given that the method is specifically email-based, it is poorly suited to contexts where email is not widely employed, such as retail stores, hospital floors with nurses taking care of patients or restaurants where chefs and waiters communicate directly. In the future, however, it might be possible to adapt the approach to track communications through other electronic media, such as instant messaging services and voice-over-IP telephony. Of course, the specific variables would have to be recalibrated for the specific environments. For instance, with creative medical research teams, we found that rotating leadership, not steady leadership, was an indicator of high performance.17 Overall, however, we think the approach has the potential to revolutionize management science by providing an automated way to assess an organization’s communications and compare it with the organization’s performance.
References
1. F.F. Reichheld, “The One Number You Need to Grow,” Harvard Business Review 81, no. 12 (December 2003): 46-54.
2. A.S. Pentland, “Honest Signals: How They Shape Our World” (Cambridge, Massachusetts: MIT Press, 2008).
3. P.A. Gloor, K. Fischbach, H. Fuehres, C. Lassenius, T. Niinimaki, D.O. Olguin, A. Pentland, A. Piri and J. Putzke, “Towards ‘Honest Signals’ of Creativity — Identifying Personality Characteristics Through Microscopic Social Network Analysis,” Proceedings of COINs 2010, Collaborative Innovation Networks Conference, Savannah, Georgia, October 7-9, 2010, in Elsevier Procedia - Social and Behavioral Sciences 26 (2011): 166-179.
4. F. Merten and P. Gloor, “Too Much E-Mail Decreases Job Satisfaction,” Proceedings of COINs 2009, Collaborative Innovation Networks Conference, Savannah, Georgia, October 8-11, 2009, in Elsevier Procedia - Social and Behavioral Sciences 2, no. 4 (2010): 6457-6465.
5. S.L. Hybbeneth, D. Brunnberg and P. Gloor, “Increasing Knowledge Worker Efficiency Through a ‘Virtual Mirror’ of the Social Network“ (paper presented at the Fourth International Conference on Collaborative Innovation Networks COINs13, Santiago, Chile, August 11-13, 2013).
6. S. Aral and M.W. Van Alstyne, “Network Structure & Information Advantage,” Proceedings of the Academy of Management Conference, Philadelphia, (2007).
7. Y.H. Kidane and P. Gloor, “Correlating Temporal Communication Patterns of the Eclipse Open Source Community with Performance and Creativity,” Computational & Mathematical Organization Theory 13, no. 1 (March 2007): 17-27.
8. P. Gloor, D. Oster, J. Putzke, K. Fischbach, D. Schoder, K. Ara, T. Kim, R. Laubacher, A. Mohan, D. Olguin Olguin, A. Pentland and B. Waber, “Studying Microscopic Peer-to-Peer Communication Patterns,” Proceedings of the AMCIS Americas Conference on Information Systems, Keystone, Colorado, August 9-12, 2007.
9. E.M. Whitener, S.E. Brodt, M.A. Korsgaard and J.M. Werner. “Managers as Initiators of Trust: An Exchange Relationship Framework for Understanding Managerial Trustworthy Behavior,” Academy of Management Review 23, no. 3 (July 1998 ): 513-530.
10. P.A. Gloor, R. Laubacher, S.B.C. Dynes and Y. Zhao, “Visualization of Communication Patterns in Collaborative Innovation Networks: Analysis of Some W3C Working Groups” (paper presented at ACM CIKM International Conference on Information and Knowledge Management, New Orleans, Louisiana, November 3-8, 2003).
11. Merten and Gloor, “Too Much E-Mail Decreases Job Satisfaction.”
12. Aral and Van Alstyne, “Network Structure & Information Advantage.”
13. Ibid.
14. Hybbeneth et al. “Increasing Knowledge Worker Efficiency.”
15. X. Zhang, P.A. Gloor and F. Grippa, “Measuring Creative Performance of Teams Through Dynamic Semantic Social Network Analysis,” International Journal of Organisational Design and Engineering 3, no. 2 (2013): 165-184.
16. Gloor et al., “Studying Microscopic Peer-to-Peer Communication Patterns.”
17. Zhang et al., “Measuring Creative Performance of Teams.”
i. D. Brunnberg, P.A. Gloor and G. Giacomelli, “Predicting Client Satisfaction Through (E-Mail) Network Analysis: The Communication Score Card” (paper presented at the Fourth International Conference on Collaborative Innovation Networks COINs13, Santiago, Chile, August 11-13, 2013).
ii. Merten and Gloor, “Too Much E-Mail Decreases Job Satisfaction.”
iii. Hybbeneth et al., “Increasing Knowledge Worker Efficiency.”
iv. Aral and Van Alstyne, “Network Structure & Information Advantage.”