Supplier Relations in Japan and the United States: Are They Converging?
Topics
Supplier-customer relationships in the United States are changing rapidly. Where once contracts were short-term, arm’s-length relationships, now contracts have increasingly become long term. More and more, suppliers must provide customers with detailed information about their processes, and customers talk of “partnerships” with their suppliers.
Such close relationships between customers and suppliers have had beneficial effects on performance in several areas. Clark found that early supplier involvement in product design was key to Japanese automakers’ edge in introducing new models both faster and with fewer total labor hours than their U.S. and European counterparts.1 Noordeweier, John, and Nevin found that more “relational” purchasing arrangements reduced acquisition costs during uncertainty.2 And Heide and John found that mutually dependent customers and suppliers invested more in specific assets.3
Despite the movement toward closer supplier relations in the United States and evidence that such relationships improve performance in a number of ways, there are contradictory trends. Helper’s 1989 survey of U.S. auto suppliers found that customers had increased the length of the contracts they offered, and suppliers were more likely to provide process information.4 However, suppliers still felt a lack of customer commitment, since their level of trust in the customer did not increase. Performance improvements often came at the suppliers’ expense. For example, JIT delivery was not matched by JIT production, so in 1989, 48 percent of suppliers ended up stockpiling inventory to meet their customers’ delivery demands, compared with 20 percent in 1984. In addition, customers often obtained price reductions by reducing supplier margins rather than supplier costs.
To see if a clear trend had emerged from these conflicting patterns, in 1993, we surveyed U.S. and Japanese automotive suppliers (Helper, in the United States, and Sako, in Japan). The surveys yielded an unusually comprehensive database. In the United States, 675 responses came from Japanese transplants and vertically integrated divisions of U.S. automakers as well as independent U.S.-owned firms, for a response rate of 55 percent. In Japan, we received 472 responses from vertically integrated divisions of Japanese automakers and a few foreign-owned companies as well as independent Japanese-owned firms, for a response rate of 30 percent (see the appendix for a description of our survey methodology).
We designed the surveys to answer the following questions:
- What is the extent of the changes in supplier relationships described above? How different or similar are the trends in the United States and Japan?
- What types of relationships are likely to lead to good performance by both suppliers and buyers?
While our data come from the automotive industry, we believe that our results are of general interest. “Voice” and “exit” are generally applicable approaches to supplier relations. Even in service sectors such as health care, practitioners are working to discover the costs and benefits of long-term relationships between suppliers (such as physicians) and customers (patients). Because managers in the auto industry have been struggling for many years now to develop successful approaches to supplier relations, we can observe many experiments with different policies. Managers in all industries can benefit from close observation.
Types of Supplier-Customer Relationships
Traditional studies of purchasing have emphasized the distinction between “make” and “buy.”5 However, to analyze different options within the buy alternative, another framework is necessary, so we chose the “exit-voice” framework to classify supplier relations according to the ways problems between the parties are resolved.6 In an exit relationship, a customer that has a problem with a supplier finds a new supplier. In a voice relationship, the customer works with the original supplier to resolve the problem.
In most cases, a voice relationship is more efficient, since the flow of information between the parties makes techniques such as value analysis and value engineering more effective. However, a customer that wants to have a voice relationship with its suppliers must make a commitment that it will continue to buy the supplier’s products for some length of time. This assurance can come from any mechanism that makes it hard for the customer to exit from the relationship, such as vertical integration, long-term contracts, or a desire to retain suppliers’ trust.7 Commitment is necessary both to obtain suggestions for improvement (which may be based on proprietary information) and to make investments that respond to these suggestions.
We use this framework first to investigate the trends in adopting these relationships in the United States and Japan. Second, we examine the impact of voice relationships on performance (see the sidebar).8
Trends in Supplier Relations
As we noted earlier, the 1989 survey of U.S. companies identified contradictory trends in supplier relations during the 1980s. Have these problems been resolved in the 1990s? As we discuss, supplier relationships are still moving in contradictory directions, not only in the United States but also in Japan.
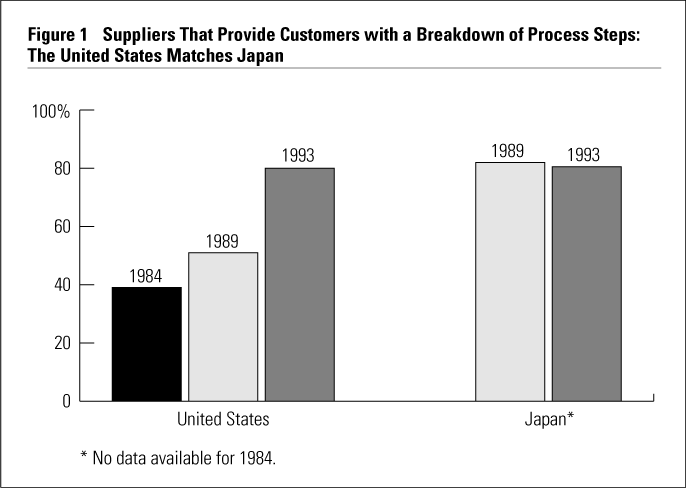
In the United States, between 1984 and 1993, more suppliers provided their customers with a detailed breakdown of the steps in their production process, an increase that is compatible with a trend toward voice relationships (see Figure 1). The information helps automakers ensure that their component designs are compatible with suppliers’ processes, thus improving productivity and quality. A large increase in information disclosure in the United States, from an average of 38 percent in 1984, 50 percent in 1989, and 80 percent in 1993, starkly contrasts with the slight decrease in Japan, from around 80 percent in 1989 to around 77 percent in 1993. (No Japanese data are available for 1984, unfortunately.)
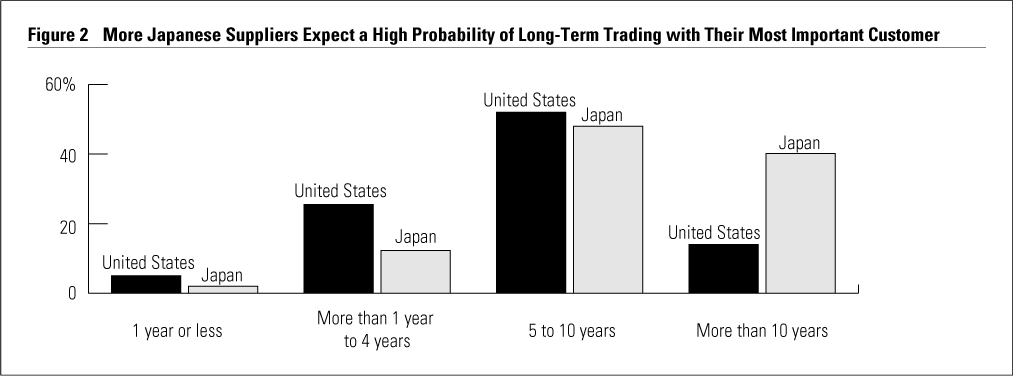
Another trend indicating progress toward voice relations in U.S. companies is contract length, which increased from an average 1.2 years in 1984, to 2.3 years in 1989, and to 2.4 years in 1993. (However, the increase in the average conceals a sharp decrease in contract lengths reported by suppliers to one automaker.) In Japan, the practice of no product-specific contracts prevailed for two-thirds of the respondents in both 1989 and 1993. The U.S.-Japanese difference in commitment cannot be measured by comparing contract length because the implicit contract in Japan tends to be longer than the basic contract, which is renewed annually. An alternative measure of customer commitment is the supplier’s estimate of how long it will continue to supply the same customer. As shown in Figure 2, 87 percent of Japanese suppliers, compared with 68 percent of U.S. firms, thought that their customer’s commitment would last more than four years, the typical duration of a model cycle. The actual record of trading with the same customer was significantly longer in Japan than in the United States. Almost two-thirds of U.S. firms (but only a quarter of Japanese firms) had supplied their customer a product in the same product line for ten years or less, and less than 5 percent had supplied the customer for more than twenty years. In contrast, over half of Japanese suppliers had traded with their customer for twenty years or longer.
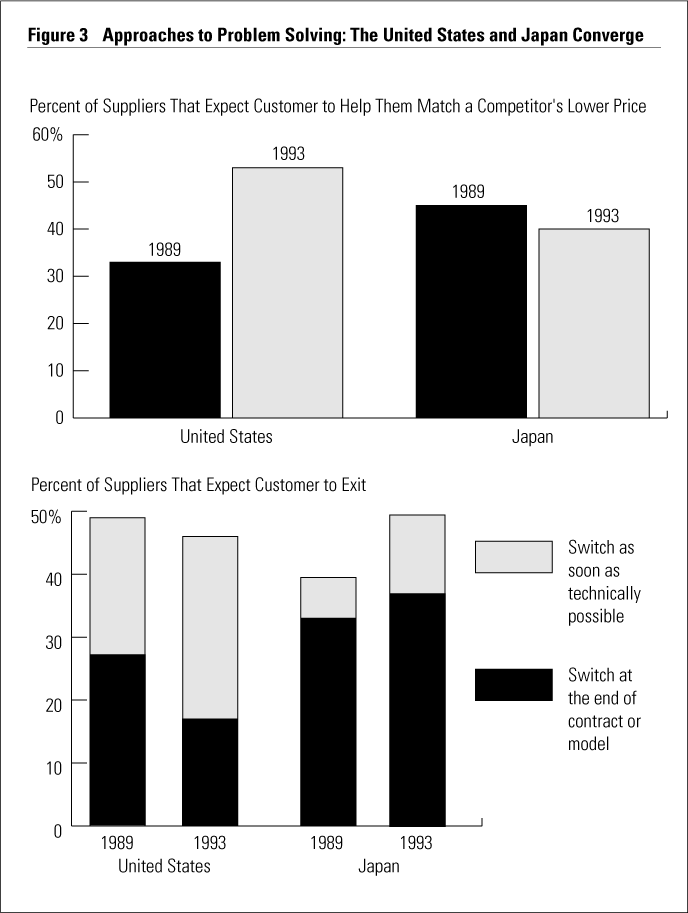
The third indicator of voice relationship is an orientation toward joint problem solving. If a competitor offers a lower price for a product of equal quality, an increasing proportion of U.S. suppliers (from an average of 32 percent in 1989 to 51 percent in 1993) said their customers would help match a competitor’s effort (see Figure 3). The move of U.S. firms toward a voice relation contrasts with the Japanese companies’ move toward exit relations. Japanese suppliers that expected their customers to offer help declined from 45 percent to 40 percent, while those that expected them to switch to the competitor “as soon as is technically feasible” rose from 40 percent in 1989 to 49 percent in 1993. Thus, in 1993, U.S. suppliers were less likely to experience “exit” in this situation than Japanese suppliers.
More Japanese suppliers (39 percent) gave multiple responses to this question on problem solving than U.S. suppliers (23 percent), indicating that Japanese assemblers have more ways to simultaneously discipline or control suppliers than their U.S. counterparts do. For instance, 13 percent of firms in Japan, but only 6 percent in the United States, thought that their customer would help match a competitor’s effort but would also switch at the end of the contract, presumably if the price was not matched. Here, assemblers used the possibility of exit to make their voice relationship effective.
To summarize, more and more U.S. suppliers have given their customers a detailed breakdown of process steps, so that the gap between U.S.-Japanese companies was eliminated by 1993 in this respect. At the same time, customer commitment, measured by either past record or suppliers’ future projections, remains higher in Japan than in the United States. In joint problem solving, suppliers’ expectations of a voice response have increased in the United States but declined in Japan. Thus there has been a limited, yet noticeable, convergence in the nature of U.S. and Japanese supplier-customer links.
Impact of Voice Relationships on Performance
The 1993 surveys show that, in today’s competitive environment, a voice relationship can benefit both automakers and their suppliers. For example, consider the performance impact of a very relaxed voice relationship in which: (1) a supplier provides the customer with a detailed breakdown of its process steps, (2) a supplier believes it is highly probable that it will continue to provide products to this customer for more than three years, and (3) if a competitor offers a lower price, the supplier expects the customer to help it match the competitor’s effort.
U.S. firms with such relationships do better for their customers (28 percent more awards from the auto-makers) and for themselves (market-share growth between 1989 and 1993 was 1.5 percentage points higher), and they were 10 percent more likely to adopt JIT delivery without a cost increase. (Automakers give suppliers awards, such as Ford’s Q1, for good performance in areas such as quality and on-time delivery.) However, only 29 percent of respondents had relationships that met even these minimal voice relationship criteria in 1993.
Japanese firms with such relationships also performed much better than those without. A supplier with a voice relationship receives, on average, 18 percent more awards from the automakers. Also, it is 50 percent more likely to adopt JIT delivery without a cost increase. (No market-share growth advantage was evident for voice suppliers in Japan.) But, even in Japan, only 32 percent of respondents had relationships that met the voice criteria in 1993.
It is important to emphasize that “voice is not a cozy relationship,” as one manager of a supplier company commented. More than 51 percent of voice suppliers would have to absorb part of any increase in material cost, whereas 29 percent of nonvoice suppliers were subject to this “partial passthrough” system. In contrast, 16 percent of nonvoice suppliers were able to pass through all material price increases to their customers; only 7 percent of voice suppliers were.
Just-in-Time Production and Delivery
Voice relationships help alleviate another problem documented in the 1989 survey: the large batches suppliers produce. In 1984, U.S. suppliers produced in batches that would last their customers an average of nineteen days. Suppliers also delivered to their customers on average every nineteen days. By 1989, both production and delivery batch sizes had fallen significantly. However, much of the change took place in lot sizes delivered, indicating that many suppliers were stockpiling their product. In 1993, more than half of U.S. suppliers were delivering batches smaller than those they produced, indicating that they were stockpiling inventory. But the median difference between production and delivery lot sizes has shrunk for all firms since 1989 (see Figure 4).
However, the median lot sizes for both production and delivery are significantly smaller for firms that have had voice relationships. Five years ago, the median production lot size was the same for both nonvoice and voice firms. Since then, however, the voice firms have made investments so they could reduce production lot sizes from ten days to five days. In contrast, nonvoice firms have reduced their production lot sizes to only seven days. Delivery performance for voice suppliers is also superior: they deliver every two days, while nonvoice firms deliver every four days.
In Japan, as Figure 4 shows, there has been no improvement in the average production and delivery lot sizes since 1989. Without comparable survey observations before 1989, we must refer to other studies that show that production and delivery batches were reduced in Japan in the 1970s and early 1980s.9 What the 1993 survey shows, however, is that voice suppliers perform better than nonvoice suppliers. In 1989, the median lot size for delivery was the same for voice and nonvoice suppliers. Since then, only the voice suppliers have achieved a reduction in delivery batches. Moreover, median production batches have been significantly smaller for voice suppliers since 1989. In 1993, voice suppliers produced in lots that last the customer twelve hours and delivered every five hours.
Overall, despite dramatic improvements in the past ten years in the United States, U.S. suppliers, on average, produce in lots four times as large as Japanese suppliers, while Japanese suppliers deliver six times more frequently than U.S. suppliers (if one day is converted to sixteen hours with two shifts per day). But, as in the United States, about half of the Japanese suppliers delivered batches smaller than those they produced, indicating that they were stockpiling inventory.
The continuing gap between production- and delivery-batch size explains why more than half of all suppliers in the United States and just over one-third of all suppliers in Japan agree with the statement, “JIT only transfers inventory responsibility from customers to suppliers.” The percentage of all U.S. suppliers agreeing with the statement is slightly higher than in the 1989 survey. In both the United States and Japan, suppliers with voice relationships were less likely to endorse the statement (33 percent in the United States and 30 percent in Japan).
Costs and Margins
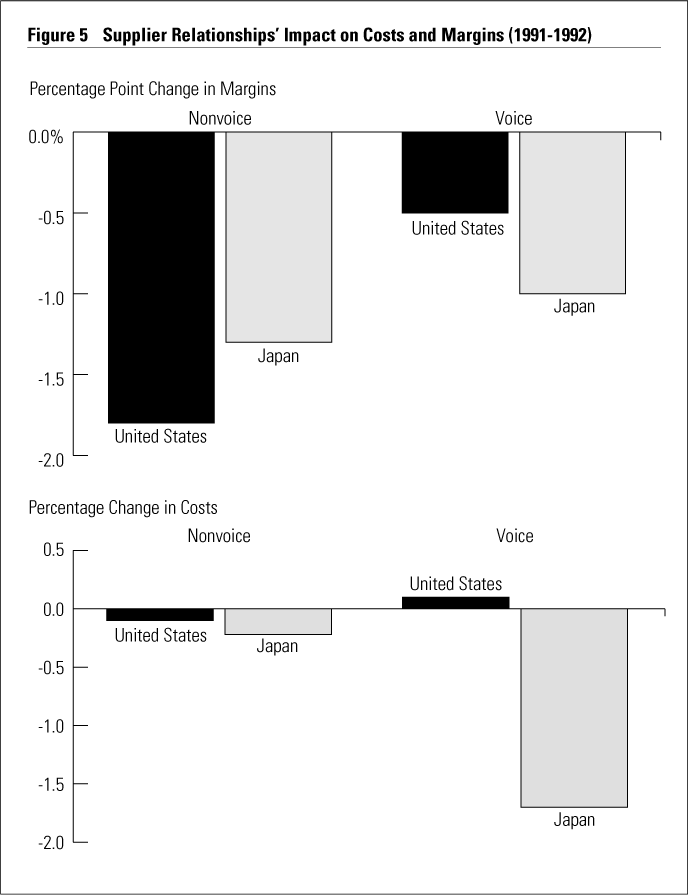
Voice relations have not made much of a difference in the U.S. companies’ costs and profits (see Figure 5). Despite the promise of “continuous improvement,” suppliers’ costs have not been reduced: average supplier costs actually rose almost 2 percent per year in nominal terms between 1988 and 1992, although costs did fall slightly between 1991 and 1992. Supplier margins fell almost one percentage point per year between 1988 and 1992, and at an even faster rate between 1991 and 1992.10 Voice suppliers were not any more successful at cost reduction than nonvoice suppliers and were not significantly more able to defend their margins.
In Japan, average supplier costs declined 0.2 percent per year in nominal terms between 1988 and 1992, but 0.7 percent in 1991 to 1992. Supplier margins fell also, at one percentage point per year between 1988 and 1992. In contrast to U.S. firms, Japanese voice suppliers did outperform nonvoice suppliers in cost reduction by 1.5 percent per year (see Figure 5). But they were not significantly better at defending their profit margins.
As a result, suppliers in the United States are reducing their prices, but this is often due to reduced supplier margins rather than reduced supplier costs. In Japan, suppliers are reducing their costs, but since prices are falling even faster, supplier margins are squeezed.
Supplier Relations at a Crossroads
In both the United States and Japan, our surveys identified better performance among suppliers that provide detailed process information to their customers, see their customer commitment as long term, and expect to engage in joint problem solving with the customer. However, these voice suppliers constituted only a minority: 29 percent in the United States and 32 percent in Japan. Between 1989 and 1993, according to the surveys, there has been an overall trend toward convergence between Japanese and U.S. practices, with the U.S. suppliers moving toward voice relationships, and Japanese suppliers moving slightly toward exit.
Our cross-country comparison disguises different dynamics within each country. In the United States, suppliers are significantly more likely than they were five years ago to provide detailed information to their customers, have long-term contracts, believe that their customers are serious about product quality, and have defect-prevention systems in place. These results indicate progress toward a voice model of supplier relations, in which suppliers play an important role in solving problems and developing fresh ideas about products and processes.
On the other hand, U.S. suppliers do not feel that their customers are more trustworthy than they were five years ago, do not receive much assistance from them in reducing costs or adopting new techniques, and are not convinced of the efficacy of JIT. All these factors show that a voice model of supplier relations is not yet firmly in place in the U.S. auto industry.
One factor that might account for the mixed picture in the United States is the divergence in purchasing strategy adopted by automakers producing in the United States. Our survey identified three distinct supplier relations strategies: One is a return to an exit relationship in which suppliers receive only short-term contracts (which average only slightly more than a year) and must bid against many other suppliers, largely on the basis of price, for renewal. The second is a consistently voice-based relationship that has produced significant supplier cost reductions. Companies using the third strategy used exit in 1983 but have moved consistently toward a voice relationship, with longer contracts and steady increases in suppliers’ perceptions of their fairness. While these strategies are internally consistent, it remains to be seen whether they are compatible with each other. Given that the U.S.-based automakers share much of the same supplier base, it may be unrewarding for some of them to use voice relations to promote investment, while other customers are reducing supplier margins in an effort to cut their own short-term costs.
Our survey data show that Japanese suppliers, compared to U.S. suppliers, still enjoy superior performance in a number of ways, including just-in-time production and delivery. This is a pay-off from long-term customer commitment and investment in voice relationships during the past few decades. But trends toward exit are present among some firms in Japan. Just when some U.S.-owned automakers have realized the need to establish voice relationships with suppliers in order to compete on quality and technology in the global auto industry, some Japanese automakers are signaling that they will use the exit option.
The Japanese trend toward exit relationships may be a temporary, minor adjustment to the present contraction in car sales. There is some support for this in our data; the weaker suppliers have borne the brunt of the change to an exit strategy. For example, suppliers that expected in 1993 but not in 1989 that their customers would exit if their costs rose are those with a low switching cost from the assembler’s viewpoint. In particular, their degree of customer-specific investment was low, the number of potential suppliers producing a similar product was large, and their contribution to the product development process was small, relative to those not expecting exit recently. There is, however, no clear pattern in the distribution of such recent exit suppliers in relation to the extent of financial distress suffered by the Japanese assemblers.
Another possibility may be that Japanese automakers are adopting the exit strategy more widely as they feel that their suppliers’ efforts at continuous improvement in areas such as JIT production and cost reduction on existing products are no longer paying off. Instead, they may be looking for suppliers that can develop entirely new products. Interviews at three Japanese automakers in late May 1994 support this view. All three planned to increase their total number of suppliers significantly to take advantage of new supplier capabilities that they had discovered in purchasing for their overseas operations. (For example, our survey found that only 5 percent of Japanese suppliers’ revenues came from products not produced in 1989, one-fifth as much as the median U.S. supplier.)
At this time, it is hard to choose between the two possibilities — that Japanese assemblers’ exit strategy is a temporary reaction to financial pressure, and that it is a more permanent response to opportunities created by globalization of the industry. Thus the automotive industry is at a crossroads. The current situation in both the United States and Japan shows the tension in auto-makers’ desires to be able to select the best supplier at any point in time (a goal more likely to be met by using the exit strategy), while being able to create good suppliers by working with them over a long period of time (more likely with the voice strategy).
Appendix
In spring 1993, we mailed the North American survey to every automotive supplier and automaker components division in the Elm Guide to Automotive Sourcing (East Lansing, Michigan: Elm, Inc.), which lists the major first-tier suppliers (both domestic and foreign-owned) to manufacturers of cars and light trucks in the United States and Canada. The target respondents were the divisional director of marketing at independent firms and the divisional business manager or director of strategic planning at auto-maker components divisions. We selected them because they would have the broadest knowledge about both customer relationships and about their firms’ products and processes. The respondents had a wealth of experience: they averaged more than eighteen years in the auto industry and more than eleven years with their companies.
In Japan, we sent the survey (in Japanese) in July 1993 to all members of the Japan Auto Parts Industries Association (JAPIA), all automotive suppliers named in Nihon no Jidosha Buhin Kogyo 1992/1993 (Japanese Automotive Parts Industry) (Tokyo: Auto Trade Journal Co., Inc. and JAPIA, 1992), and automakers’ components divisions. This publication lists all the first-tier suppliers (both domestic and foreign-owned) to the eleven assemblers of cars and trucks in Japan. To maintain consistency with the U.S. sample, we asked respondents not to consider heavy trucks and buses in their answers. The target respondent in Japan was the director of sales and marketing at independent firms. We sent the survey to the main contacts named by JAPIA, many of whom were either chief executives or marketing directors. JAMA (Japan Auto Manufacturers Association) identified the respondents for automaker components divisions. The Japanese respondents were generally well experienced; they had worked an average twenty-two years at their companies.
Because many companies supply their customers with several different products, and their relationships with their customers differ by product, respondents in both North America and Japan were asked to answer the survey for their most important customer about one typical product in their company’s output. The responses were far above the norm for business surveys. For the 1989 survey (done in the United States only), the response rate was 49 percent. For the 1993 surveys, it was 55 percent in the United States and 30 percent in Japan (45 percent among JAPIA members), after accounting for those firms that were unreachable (mail sent to them was returned undelivered), and those ineligible to answer the survey (they were not first-tier automotive suppliers, or they specialized in supplying for heavy trucks and buses).
References
1. K. Clark, “Project Scope and Project Performance: The Effect of Parts Strategy and Supplier Involvement on Product Development,” Management Science 35 (1989): 1237–1263.
2. T.G. Noordeweier, G. John, and J.R. Nevin, “Performance Outcomes of Purchasing Arrangements in Industrial Buyer-Vendor Relationships,” Journal of Marketing 54 (1990): 80–95.
3. J. Heide and G. John, “The Role of Dependence Balancing in Safeguarding Transaction-Specific Assets in Conventional Channels,” Journal of Marketing 54 (1988): 20–35.
4. S. Helper, “How Much Has Really Changed between U.S. Automakers and Their Suppliers?” Sloan Management Review, Summer 1991, pp. 15–28.
5. O. Williamson, Markets and Hierarchies (New York: Free Press, 1975).
6. A. Hirschman, Exit, Voice, and Loyalty (Cambridge, Massachusetts: Harvard University Press, 1970);
S. Helper, “Strategy and Irreversibility in Supplier Relations: The Case of the U.S. Automobile Industry,” Business History Review, Winter 1991, pp. 781–824; and
Helper (1991a).
7. M. Sako, Prices, Quality and Trust: Interfirm Relations in Britain and Japan (Cambridge: Cambridge University Press, 1992).
8. Unless otherwise noted, all comparisons reported are statistically significant at the .05 level or better according to the Kruskal-Wallis test (a nonparametric version of the t-test). See:
W.J. Conover, Nonparametric Statistics (New York: John Wiley, 1971).
9. M. Lieberman, “The Diffusion of ‘Lean Manufacturing’ in the Japanese and U.S. Auto Industry” (Los Angeles, California: University of California, Anderson School of Management, working paper, 1994).
10. A percentage point change measures the difference between one rate and another rate. For example, the change between a 6 percent margin and a 4 percent margin is 2 percentage points.