The Global Costs of Opacity
Topics
Over the years, businesses have evolved a number of innovative ways to manage the risks associated with global operations. They have developed sophisticated ways to insure their infrastructures and their operations and to hedge their currencies. They have learned how to distribute information resources globally, using highly resilient computer networks with geographically dispersed backups. They have put in place sophisticated new internal controls systems to monitor performance and tease out fraud on a global basis. They have developed intricate taxonomies to enable different divisions to rate and communicate their risks in a consistent manner around the world. They have even created a new global role — the chief risk officer — to watch over the company as a whole. And many boards of directors have made risk management one of their top priorities. But despite these initiatives, gaps remain.
Global companies face two distinct types of risks: large-scale, low-frequency risks and small-scale, high-frequency risks. Although the large-scale risks — earthquakes, wars, coup d’états and major acts of terrorism — are front-page news, the small-scale risks — fraudulent transactions, bribery, legal and regulatory complexity, and unenforceable contracts — represent the real costs to business. These risks interfere with commerce, add to costs, slow growth and make the future even more difficult to predict. They also deter investment. “The key to any good investment relationship is clarity — the ability to see, and even be in communication with, what’s really going on. It’s the same whether it’s a company, a country or a region,” said Matt Feshbach, chief investment officer of MLF Investments Inc., a midsized hedge fund in Largo, Florida. “If the risk picture is unclear, capital is less likely to go where it’s needed.”
Annually since 2000,1 we have been studying a variety of countries, seeking to identify their degree of opacity — that is, the degree to which they lack clear, accurate, easily discernible and widely accepted practices governing the relationships among businesses, investors and governments that form the basis of most small-scale, high-frequency risks. Greater awareness of the risk factors that may impede commerce can enable companies to make better portfolio and direct investment decisions regarding where to develop markets, locate productive resources or find the best outsource partner and can also help governments understand how to measure their progress and make their countries more attractive locations for investment.
Toward that end, we developed a methodology for projecting what aspects of a country’s economy carry the greatest risk. After talking with companies and financial and economic experts, we discovered that, in any country, small-scale, high-frequency risks fall into one of five broad causal categories (which form the acronym CLEAR): business and government corruption, an ineffective legal system, deleterious economic policy, inadequate accounting and governance practices and detrimental regulatory structures.
By assessing and comparing the costs of those risks on a country-by-country basis, we create an overall Opacity Index,2 in which higher levels of opacity strongly correlate with slower growth and less foreign direct investment in all markets (except China, where the size of its market and labor force attracts large-scale investment despite what appear to be very high levels of risk).
The Opacity Index
The Opacity Index draws upon 65 objective variables from 41 sources including the World Bank, the International Monetary Fund, the International Securities Services Association, the PRS Group (which publishes the International Country Risk Guide), the International Country Risk Guide and the regulators of individual countries. Considerable effort was made to ensure that the data are directly comparable across the 48 countries studied. (Early attempts to do survey-based research proved less than optimal because many business leaders did not know enough about business practices in other countries to make meaningful comparisons with their own.) An array of data is compiled and ranked for each of the CLEAR factors.
To understand how the Index works and what it measures, consider how the research assesses legal systems. We gathered data from a variety of publicly available sources — such as the Global Competitiveness Report, the International Country Risk Guide and the Index of Economic Freedom — in order to examine a country’s overall legal environment and obtain a gauge of how effectively its legal system resolves business disputes and what protections it grants to businesses, investors and other sources of capital. Factors such as whether bankruptcy procedures allow the continued operation of a business, whether shareholders have preemptive rights that can only be waived by a shareholders’ vote, the country’s degree of judicial independence, its strength of property rights and even the level of religious tension are evaluated and compiled to construct an overall score.
Similarly, we drew on a number of sources to measure and compare the economic risks that challenge businesses and that summarize the economic costs of doing business in various countries. We examined traditional and nontraditional economic factors such as the influence of organized crime, the cost of terrorism and costs relating to bureaucratic “red tape” and nontransparent taxation systems.
Our examination of regulation, particularly as related to the capital markets, measures how safe it is to provide capital to various countries. We sought to answer two broad questions: (1) Can investors in a given country get a full understanding of the companies in which they invest? And (2) are there mechanisms for settling disputes that arise out of the investment process? In addition to these issues, we were concerned with how well the countries we studied conformed to the robust regulatory practices that are in use in countries like the United Kingdom and the United States, which have very large capital markets that are, for the most part, well run.
To create our assessment of corruption, we compiled data from existing indices, most notably from Transparency International3 and the International Country Risk Guide. There is some overlap in the areas of business cost of corruption and that of terrorism, which is included in the category that focuses on economic factors. This inclusion is intentional because firms often do not, perhaps cannot, clearly discern between these costs, as they are often assumed to be necessary in order to operate in a country. To better assess the opacity cost to businesses, corruption costs need to be taken into account both individually and with other opacity factors, depending on the type of business being considered.
Most of the data we compiled to measure the transparency in countries’ accounting practices take the form of yes or no answers to questions such as: Does the country require an independent audit by an external auditor? Are there annual banking inspections? Are a country’s accounting standards in accord with international standards? Comparing a country’s data to various benchmarks and standards established around the world yields an overall understanding of whether the finances of companies in that country can be viewed with confidence by those outside the company.
After having collected and compiled data in all the above-mentioned categories,4 we calculated five subindices for each country under examination, one subindex for each CLEAR factor, using simple averages. A country’s final score is the simple average of the five subindices.(See “The Opacity Index.”) We believe these scores are a reliable reflection of each country’s everyday business risks. Further, each individual subindex score allows companies to assess where those risks are most prevalent — in the country’s legal system, its economy, its accounting standards, its regulation policy or its vulnerability to corruption.
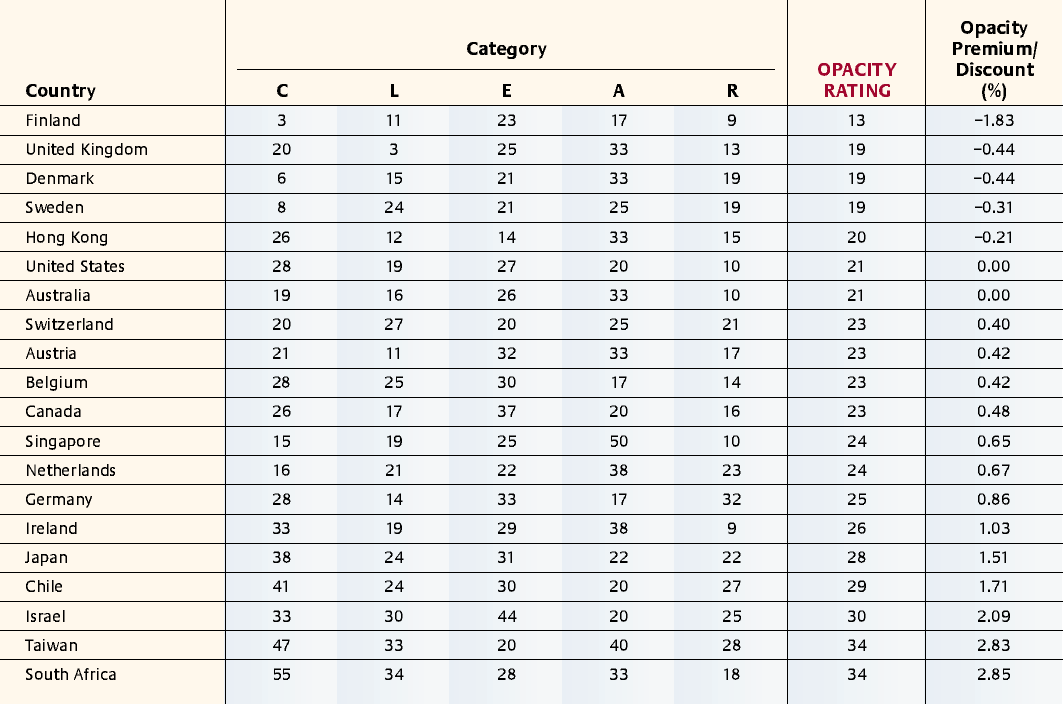
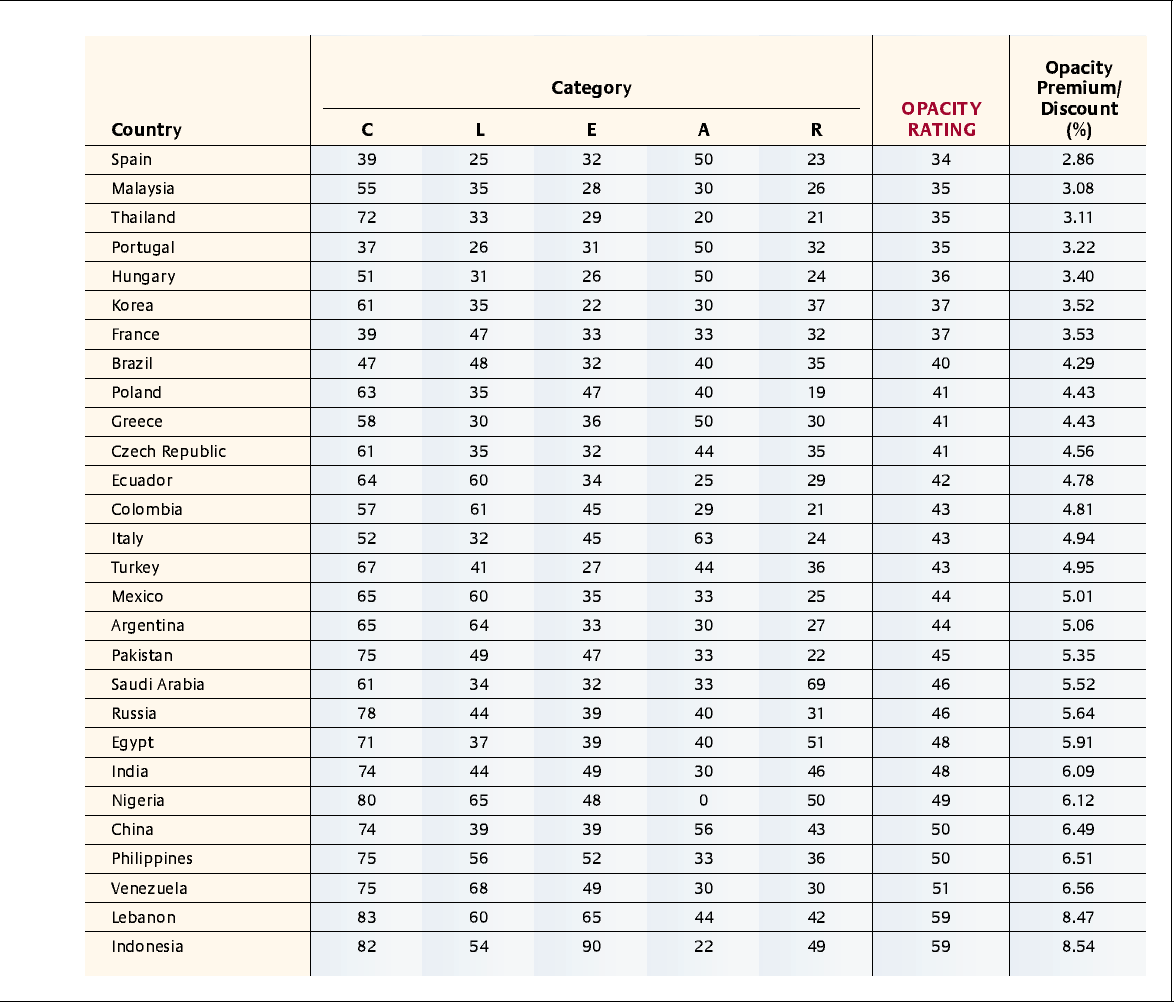
To put these risks into business terms, each final score is associated with an opacity risk premium (or discount), which is expressed as an interest-rate equivalent. (For purposes of this study, the opacity risk premium/discount5 is calculated by taking the numerical difference in opacity between the subject country and the United States and multiplying it by 0.2213.) This means in practice that if a U.S. investor wants to do business in France, he needs to receive a return 3.53% greater than in the United States to offset the risk. If he wants to do business in China, he needs to receive a return 6.49% greater. If an investor wants to do business in Finland, she could actually receive a smaller rate of return than in the United States and still justify the investment.
Correlating Opacity With Other Indicators
We correlated the Opacity Index with various other indicators to check its efficacy. For example, because opacity impedes the development and efficient functioning of a financial system —the markets as well as business processes and operations — one would expect to find highly opaque countries among the countries that are least developed and least able to develop. What’s more, opaque countries should be among the slower-growing countries in the developed world.
Income
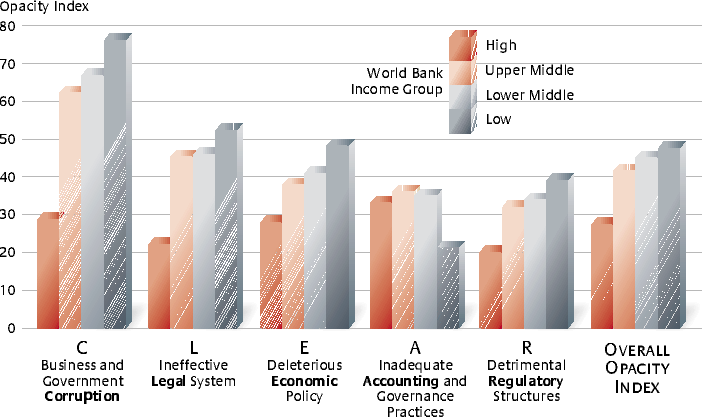
To test these relationships, we looked for consistent differences between the average Opacity Index and individual scores among the four World Bank income groups. (See “Average Scores by World Bank Income Group.”) We found that, as income decreases, opacity increases for each factor except accounting. The accounting exception is probably because lower-income countries tend to more uniformly adopt international accounting standards, possibly to counter high opacity in other factors.
Economic Development and Foreign Investment
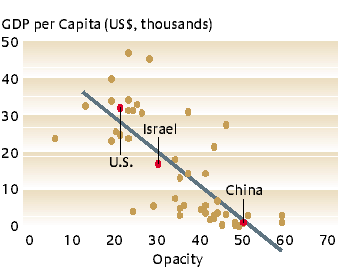
Our analysis shows that real gross domestic product per capita, a common measure of economic development, is lower in countries with higher levels of opacity and is higher in countries with lower levels of opacity. (See “Opacity Vs. Economic Development.”) We estimate that per capita income decreases by $986 for every one-point increase in the Opacity Index.6 This suggests a strong association between prosperity and the lessened risk levels that come from transparent processes in each of the five areas we studied. It further suggests that opacity acts as a brake on the pace of economic development.
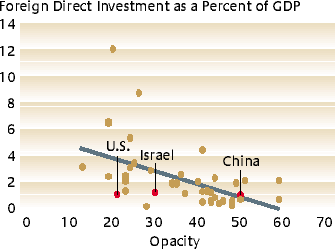
Opacity can affect economic development indirectly by deterring foreign direct investment. Since FDI is an amalgamation of stable investment funds, advanced technology, efficient managerial skills and easier access to the world market, it has a positive impact on economic growth and development. Opacity also has a negative and significant impact on FDI as a percentage of GDP. (See “Opacity Vs. Foreign Direct Investment.”) In the majority of cases, most foreign direct investments go to countries with relatively transparent financial and economic systems. In the case of China, which has high levels of opacity and high levels of economic development, the simple lure of China’s “bigness” has tended to make it the recipient of greater levels of FDI than would otherwise be warranted. However, the results of this study indicate that if China were to become more transparent, the amount of FDI would likely increase.
Entrepreneurship and Access to Capital
Transparency in countries’ financial and economic environments enhances the predictability of business conditions, which in turn promotes increased entrepreneurial activity. Opacity is not only a deterrent to economic development, it also decreases the ability of entrepreneurs to access capital. According to the World Bank Group’s Doing Business Database, transparency is an important indicator of the cost of starting a business and is the main factor that could enhance or constrain business investment, productivity and growth.
Opacity can starve a project of funding in many ways. By definition, opaque systems create information asymmetries between lenders and borrowers (that is, information known to some participants but not all), adding complexity and an additional burden to lenders’ expectations of return on investment. Opacity also increases the ranges of possible projected cash flows from risky projects, resulting in lower expected present values. This decreasing of expected discounted returns may ultimately result in the rejection of some projects that have strong potential but appear, because of opaque conditions, to be poor investments.
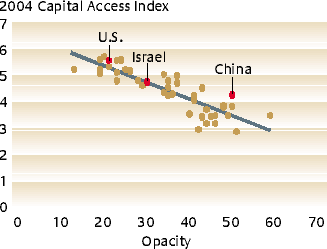
The annually produced Milken Institute Capital Access Index ranks countries on the basis of entrepreneurs’ access to capital and is based on variables that measure such market features as liquidity, interest rate volatility and the risk of expropriation. To the extent that opacity adversely affects the development and efficiency of financial markets, one would expect the Opacity Index and Capital Access Index to be significantly and negatively correlated, as they clearly are. (See “Opacity Vs. Capital Access Index.”)
Lending and Equity Markets
A country’s financial system is in many ways its most important intangible asset. The institutional capacity to generate and pool savings and invest that capital on projects and enterprises that will maximize a country’s material well-being is critical. To the extent that the size of a country’s financial system is closely related to its entrepreneurs’ ability to access capital,7 one would further expect to find a significantly negative correlation between opacity and the depth and breadth of the financial system as measured by the number, types and capitalization of financial institutions, capital markets and financial instruments and their liquidity. This clearly is the case.
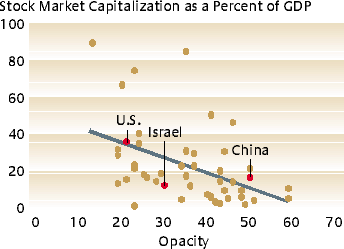
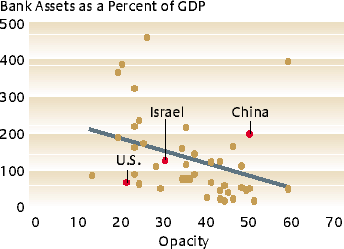
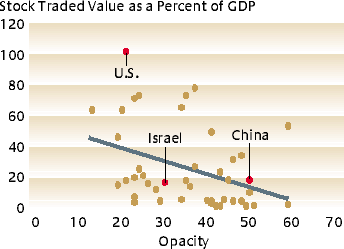
Our analysis shows that opacity correlates negatively with the size of a country’s banking system relative to its GDP. (See “Opacity Index Vs. Bank Assets.”) Opacity increases asymmetric information problems for banks, raising agency costs and perhaps the likelihood and costs of debtor defaults. The Opacity Index also shows a statistically significant and negative correlation with stock market capitalization and trading volume relative to GDP. (See “Opacity Vs. Size of Equity Market” and “Opacity Vs. Trading of Equity Market.”) Opacity can lead to wider bid-offer spreads and hence to less liquid and less efficient financial markets. Additionally, it can mask the underlying fundamentals of investments and thereby make investment in an opaque country less attractive. This in turn generates an opacity-related risk premium for that country’s firms when they raise capital.
Since financial institutions and financial markets are critical to the infrastructure of investment flows within countries and to those countries’ ability to build a broad-based business community, these findings strongly suggest that increased transparency of a country’s critical financial factors would be a stimulus to its business creation, industrial expansion and economic growth.
Countries that ignore their Opacity Index scores could face lagging rates of growth over the long haul. (See “The Negative Impact of Opacity.”) One only has to consider the difference between the development of Finland and the former Soviet Union after the end of the Cold War. Both countries were poor but had invested heavily in education, and both had abundant natural resources. Russian capitalism developed with a poorly functioning regulatory structure for its businesses, few real legal protections, a vague set of laws governing such things as property rights and very high levels of corruption and crime. Finland, on the other hand, emphasized the creation of strong institutions, regulatory structures and laws and has almost no corruption. The result? Finland now has one of the most vibrant economies in the world and is ranked No. 1, according to the World Economic Forum’s Global Competitiveness Report 2003–2004. Russia, by contrast, is ranked as the world’s 58th most competitive country.
The Company-Level View
Opacity’s correlation with slow growth, lackluster foreign direct investment, flagging equity markets and a host of other woes has obvious implications for global companies. Managers need to make decisions based on more than the size of a country’s market and the price of its labor; they need to take into account how a country’s economy works. Businesses that do not pay attention to a country’s level of opacity could find that they are making long-term decisions based on unrealistic estimates of risk and return.
Companies must understand in very quantifiable terms the cost of doing business in high-opacity countries. Doing business in Mexico, for example, which has an opacity score of 44, requires a return of 5.01% above the U.S. rate of return in order to offset a company’s risk. Doing business in China, with a score of 51, requires a premium of 6.49% to offset its risk. What this means to managers is that in some instances, China, even with its low wage rates, may be a less attractive place to do business than Mexico once the opacity risks are factored in.
A look at the individual CLEAR factors can inform even finer-grained managerial decisions since the causes of opacity might be quite different even for countries with the same overall Opacity Index rating. If managers have a choice of where to locate a regional headquarters, for example, they might choose a country that scores higher on the legal and economic subindices. If they want to build a new plant, they may care more about the corruption subindex. If they are considering a joint venture with another company, the legal subindex will indicate those locales in which the provisions of a joint venture contract will be best enforced.
This is not to suggest that businesses should avoid high-opacity countries. Indeed, in some areas of commerce such as mineral extraction and oil production, to do so would be difficult since many countries with rich natural resources have high opacity scores. Instead, businesses can use the Index to prudently measure their risks and to create mechanisms to protect themselves against those risks.
In the final analysis, the Opacity Index illustrates why it is in everyone’s interest for companies and countries to work together to bring down opacity scores: Businesses can become fully global in a prudent way, and countries can attract their fair share of inbound investment for growth and development.
References
1. The Opacity Index was initially launched in late 2000 by a joint effort of PricewaterhouseCoopers and the Milken Institute. By the first quarter of 2001, the first Opacity Index based on survey responses from corporate leaders, banking executives, equity analysts and in-country staff of PricewaterhouseCoopers was compiled and released to the public. The objective was to look beyond corruption alone in order to examine other aspects of business practice that raises costs of business and capital, inhibiting economic growth.
2. For a partial reference list of work we reviewed when constructing the Opacity Index, see http://www.milkeninstitute.org/publications/publications.taf?function=list&cat=Arts.
3. For more detail, see http://www.transparency.org/cpi/index.html.
4. For a complete list of questions addressed and the types and sources of data compiled in each CLEAR category, see http://www.milkeninstitute.org/publications/publications.taf?function=list&cat=Arts.
5. The opacity premium or discount calculation is based on estimated parameters of an augmented Fisher equation. For technical details, see http://www.milkeninstitute.org/publications/publications.taf?function=list&cat=Arts.
6. Per capita income in our sample countries ranges from $46,553 to $248. Average income of the sample is $15,278.
7. In fact, variables relating to the size, liquidity and degree of development of a country’s capital markets are used in part to calculate its Capital Access Index score.