The Talent Dividend: Interactive Infographic
An animated infographic illustrates the key stats from MIT SMR’s 2015 data and analytics report.
Deborah Gallagher
Reading Time: <1 minute
Topics
Competing With Data & Analytics
How does data inform business processes, offerings, and engagement with customers? This research looks at trends in the use of analytics, the evolution of analytics strategy, optimal team composition, and new opportunities for data-driven innovation.
More in this series
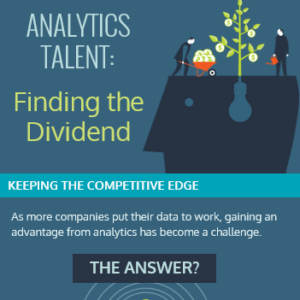
Facts and figures from MIT Sloan Management Review‘s 2015 data and analytics research report are brought to life in an interactive infographic, developed by SAS and AllAnalytics.com.
MIT Sloan Management Review’s content collaborator, SAS, and its partner site, AllAnalytics.com, have created a terrific, interactive infographic featuring the highlights from our 2015 data and analytics research report, The Talent Dividend.
The animated infographic illustrates several key stats from the report, among them:
- Four in 10 survey respondents (40%) report difficulty attracting people with analytical skills, and an equal percentage struggle to retain them.
- An increase in access to useful data since the previous year was reported by 77% of respondents.
- Of respondents who say they have appropriate analytics talent, 81% believe that business analytics creates a competitive advantage in their organization, vs. just 49% of respondents who lack appropriate analytics talent.
- Of those respondents that we categorized as “analytical innovators,” 65% give hiring preference towards those with analytics skills, vs. just 13% of those we defined as “analytically challenged.”