Why Forecasts Fail. What to Do Instead
The field of forecasting has advanced significantly in recent years. But managers need to learn from history about what they can and cannot predict, and develop plans that are sensitive to surprises.
Topics

Courtesy Of Wikipedia/ Scanned From The Genius Of William Hogarth Or Hogarth’s Graphic Works
It seems like a long time ago in a galaxy far, far away. But in reality it was 2006, on this very planet. The entire world was booming, partly on the back of triple-A investment innovations devised by a master race of financial Jedi. And then: crash, bang, global recession. Suddenly it was all over. Triple-A turned into a euphemism for “subprime,” which itself began to translate into “toxic.” The banking Jedi were cast out with no bonuses — many into bankruptcy, takeover or nationalization. Welcome to the empire of the credit crunch.
The Leading Question
How can managers use forecasting tools to plan effectively and build better strategies?
Findings
- In most areas of business, accurate forecasting is not possible. Future uncertainty is much greater than most managers acknowledge.
- Statistical regularity does not imply predictability.
- Instead of seeking predictability, managers should channel their efforts into being prepared for different contingencies.
By now, it’s a story as well known as “Star Wars.” But what fascinates us about the story of the crisis is one single, often overlooked fact — that almost no one saw it coming: none of the experts, none of the academics, none of the politicians and, as far as we know, none of the banking CEOs. So we think it’s time for business experts and practitioners to come to terms with the reality, harsh as it is, that accurate forecasts simply aren’t possible in their world. In addition to highlighting that alarming point, we’d like to offer some solace in the form of an analogy with natural disasters. We’ll also use our earthquake and hurricane comparisons to examine two types of uncertainty. Finally, we’ll provide a framework for making decisions, plans and strategies in the absence of accurate forecasts. Fundamentally, we believe that business needs a whole new attitude toward the future.
A Brief History of Prediction in the Social Sciences
To understand our fascination with the shortcomings of prediction, we invite you to travel back in time to an episode that occurred in our world of business school academia in the 1970s and 1980s. At that time, business professors and other social scientists hoped that post-space-age computing technology and sophisticated models would enable them to have the same success in forecasting as their colleagues in the physical sciences had. For a variety of reasons, these hopes were unfounded. Instead, empirical evidence has demonstrated the following:
- The future is often a bit like the past, but never exactly the same. That means that extrapolating patterns and relationships from the past to the future can’t provide accurate predictions.
- There are plenty of statistically sophisticated models that can fit — and thus “explain” — past data almost perfectly. However, these complex models don’t necessarily predict the future quite as well.
- Conversely, simple statistical models don’t explain the past very well, but they generally are better at predicting the future than are their complex counterparts.
- Empirical evidence has also shown that human judgment is even worse at predicting the future than are statistical models.
- In fact, an expert doesn’t predict more accurately than a moderately well-informed, intelligent man or woman on the street.
- Human beings are often extremely surprised by the extent of their forecasting mistakes. If statistical models were capable of emotion, they would be surprised by the size of their errors, too.
- On a more positive note, averaging the independent predictions of several individuals (whether experts or not) generally improves forecasting accuracy.1
Averaging forecasts based on more than one model also improves accuracy.
These empirical conclusions raise vital issues for anyone making business decisions: How can senior managers formulate a strategy, let alone a plan, in a context of high uncertainty and futures that they can’t even imagine?
The Sucker That Could Have Gone Down
Before pursuing an answer, let’s go back to what was arguably the worst day so far in the present crisis — Friday, October 10, 2008, when the Dow Jones Industrial Average experienced its largest one-day point drop in history (679 points) and the shares of many companies went into free fall.
Some six months earlier, Henry Paulson, the U.S. Secretary of the Treasury, was making upbeat statements:
I have great, great confidence in our capital markets and in our financial institutions. Our financial institutions, banks and investment banks are strong. Our capital markets are resilient. They’re efficient. They’re flexible.2
President George W. Bush stayed outwardly cheerful that summer. On July 15, 2008, he said:
Our economy has continued growing, consumers are spending, businesses are investing, exports continue increasing and American productivity remains strong. We can have confidence in the long-term foundation of
our economy.… I think the system basically is sound. I truly do.3
But by late September, the tone had changed. Paulson warned:
The market turmoil we are experiencing today poses great risk to U.S. taxpayers. When the financial system doesn’t work as it should, Americans’ personal savings, and the ability of consumers and businesses to finance spending, investment and job creation are threatened.4
President Bush was reportedly less circumspect, stating: “If money isn’t loosened up, this sucker could go down.”5
Why Simple Statistical Models Are Better
During the 1970s, one of the authors, a statistician who was working in a business school, realized that executives were deeply preoccupied with forecasting. Their main interest was business and economic data: the sales of their products, their company’s profits and exports, and information about exchange rates and industrial output … things like that.
The statistician was concerned that practitioners were making their forecasts without the benefit of the latest, most theoretically sophisticated methods.
Instead, they seemed to prefer simpler techniques, which they could at least explain to their bosses. And so the statistician decided to teach them a lesson. He embarked on a research project that would demonstrate the superiority of the latest statistical techniques.
The professor and his research assistant set about collecting many sets of economic and business data over time from a wide range of economic and business sources. They came up with 111 different time series, which they then used to mimic the real process of forecasting. Each series was split into two parts: earlier data and later data. The researchers simply pretended that the later part hadn’t happened yet and proceeded to fit various statistical techniques, both simple and sophisticated, to the earlier data. Treating that earlier data as “the past,” they used both approaches to predict “the future,” then sat back and compared their “predictions” with what had actually happened.
To the theoreticians’ chagrin, the practitioners’ simple techniques turned out to be more accurate than their own statistically sophisticated methods.i
In the wake of his embarrassment, the statistician searched for a way to explain why that was so. His rationale: Complex models try to find nonexistent patterns in past data; simple models ignore such “patterns” and just extrapolate trends. The professor also went on to repeat the “forecasting with hindsight” experiment many times over the years, using increasingly large sets of data and more powerful computers.ii But the same empirical truth came back each time: Simple statistical models are better at forecasting than complex ones.
So much for the politicians. What about the professionals whose job it is to forecast? Well, they didn’t fare much better. Here are some public statements by the International Monetary Fund during the period:
April 2007: “Notwithstanding the recent bout of financial volatility, the world economy still looks well set for continued robust growth in 2007 and 2008.”6
October 2007: “The problems in credit markets have been severe, and while the first phase is now over, we are still waiting to see exactly how the consequences will play out. … At this point, we expect global growth to slow in 2008, but remain at a buoyant pace.”7
April 2008: “Global growth is projected to slow to 3.7% in 2008 … Moreover, growth is projected to remain broadly unchanged in 2009. … The U.S. economy will tip into a mild recession in 2008 as the result of mutually reinforcing cycles in the housing and financial markets, before starting a modest recovery in 2009 as balance sheet problems in financial institutions are slowly resolved.”8
October 2008: “The world economy is entering a major downturn in the face of the most dangerous financial shock in mature financial markets since the 1930s. Global growth is projected to slow substantially in 2008, and a modest recovery would only begin later in 2009.”9
So Henry Paulson, George Bush and the IMF didn’t predict the credit crunch. But that doesn’t mean to say no one predicted it, right? BusinessWeek, in its annual survey of business forecasters, published on December 20, 2007,10 concluded:
The economists project, on average, that the economy will grow 2.1% from the fourth quarter of 2007 to the end of 2008, vs. 2.6% in 2007. Only two of the forecasters [out of 54 in total] expect a recession.
Could it be, then, that the current crisis is a “black swan,” the term eloquently coined by Nassim Nicholas Taleb in his 2007 book11 to mean a rare and unique event that is not only completely unexpected but also outside the realm of our imaginations? If so, we humans may be forgiven for failing to forecast it. However, before letting ourselves off the hook, let’s consider our track record of predicting in economics and business. Sadly, the record is not great.
Bubble, Bubble, Forecast Trouble
Remember the Japanese miracle? Back in the 1980s, everyone was trying to emulate Japan’s business success. The boom, fueled by gains in productivity and quality, was the envy of the world. During the 1980s, the Nikkei 225 stock index rose sixfold, from around 6,500 to almost 39,000. But at the end of 1989, the Japanese stock market began a long decline. By April 2003, when it briefly started to recover, the Nikkei 225 had lost 80.5% of its peak value.
The lesson is that, whether we’re talking about the dot-com boom of the 20th century, the South Sea Bubble of the 18th century or the Amsterdam tulip mania of the 17th century, no one can ever predict the bursting point.
So what about less ambitious forecasts directed at a single company or industry? In 1968, C. Jay Parkinson, then president of the Anaconda Co. — a major producer of copper and part of a cartel that had been hiking up its prices for more than 35 years — proclaimed, “This company will be going strong 100 and even 500 years from now.” Within 15 years the company had collapsed and the whole industry had been decimated by the invention of fiber optics, which made obsolete the use of copper wires in the telecom industry.12
Today, amid all the fuss about Bear Stearns, Lehman Brothers and AIG, it’s easy to forget that it has all happened before — and more recently than the Great Depression. In 1998, Long-Term Capital Management LP, an investment fund managed by experts that included two Nobel Prize-winning economists, was saved from bankruptcy by a consortium of banks and governmental bodies. The reason might give you a chilling sense of déjà vu: It was done in the name of saving the entire financial system.
In fairness, it’s not just business catastrophes that experts fail to forecast. They’re also often unable to predict business success. Take Google Inc., for example. At the end of the 1990s, the founders tried to sell their company with its unique search technology for $1.6 million. If they’d known that less than 10 years later it would be worth $230 billion (the market capitalization in mid-2008), they might have set their sights a little higher. Fortunately for Google’s founders, there were no takers at their modest price. Yahoo! Inc. and a whole bunch of well-known venture capitalists didn’t even make an offer.
An Analogy As Powerful As An Earthquake
Physical scientists are generally very good at making predictions. But the scientific community knows its own limits. Scientists accept that it’s impossible to predict the timing and location of large earthquakes. Indeed, current understanding of the processes that produce earthquakes suggests that no one should be able to pinpoint their occurrence in advance. Yet the intensity and frequency of earthquakes exhibit a remarkably consistent pattern. In any given year, there are roughly 134 earthquakes worldwide measuring 6.0 to 6.9 on the Richter scale, around 17 with a value of 7.0 to 7.9, and one at 8.0 or above.
Our point, however, is that statistical regularity does not equal predictability. For example, based on the historical data, we have a pretty good idea that the next 35 years will bring roughly 44 earthquakes with an intensity of 7.5 up to 7.6 on the Richter scale. But seismologists have no clue as to when or where they’ll occur (apart from being in one of the world’s earthquake-prone zones and accompanied by aftershocks). Will these zones be populated or unpopulated? Will there be a tsunami? Will they cause large-scale death and destruction? No scientist can say.
How, then, does the world cope with earthquakes? Instead of relying on prediction, the focus is on being prepared. If you’re lucky enough to live in a rich part of the world, engineers can construct buildings capable of withstanding very strong tremors. But if you live in a poor region, you take your chances and suffer the consequences.
Of course, hurricanes such as Katrina can cause just as much devastation as big earthquakes. In contrast to earthquakes, meteorologists can usually predict where hurricanes will strike a few days in advance. If you’re out at sea with a safe harbor nearby, early warning is extremely useful. On land, however, the key is being prepared: staying home, covering your windows and fastening down. In some cases there may be time and resources for a mass evacuation (as occurred with Gustav in August 2008, when 1.8 million people were moved from the coastal areas of southern Louisiana). But hurricanes can change course (as Gustav did), once again highlighting the inaccuracy of predictions.
As an analogy, think of the enormous number of small businesses or new ventures that start or fail worldwide. The precise figures vary from year to year, but there is a continual process of businesses entering and leaving the market — with some regions of the world more prone to both startup and failure than others. A few companies that hang on through the early years may go on to be hugely successful; many more simply survive. Sticking with the natural disaster analogy, small-business failures can be seen as minor movements of financial tectonics, while the collapses of the Lehman Brothers, Enrons and WorldComs are the larger tremors. And the current recession is a major earthquake, shaking Western capitalism to its core and sending huge aftershocks rippling across the world.
Back to Normal
Of course, there are limits to the earthquake analogy. Large earthquakes are extreme, if imaginable, events that occur rarely, even in temblor-prone zones. Many things that occur in the business world may not be predictable, but their unpredictability can at least be modeled. In other words, there are two types of uncertainty that practitioners need to be aware of. We call them subway and coconut uncertainty, respectively, and we’ll explain by way of a story.
Let’s imagine a character called Pierre. He’s a graduate of France’s famous engineering school, the École Polytechnique, and he lives and works in Paris. One of his passions is recording how long it takes him to get to work each morning via Paris’s highly efficient Métro system. The wait generally varies between almost nothing and just a few minutes. However, there are many one-day strikes, which can cause considerable delay or even force him to walk all the way to work. Some days, too, the large crowds of tourists on the platform can force him to miss a train.
Variations in Commuting Time to Office
The bars represent the numbers of days for different times (in minutes) that Pierre needed to get to the office. The smooth curve (in the background) shows how a normal distribution approximates Pierre’s commuting times.

The graph of Pierre’s daily commuting times fits the well-known bell-shaped curve of the normal distribution. In his statistics class, he learned that
almost all the values in a normal distribution lie within three standard deviations of the mean, while 95% lie within two standard deviations. There are almost no extreme values; most of Pierre’s journey times are clustered neatly around the average of 43 minutes. The graph represents what we call “subway uncertainty.” It effectively models the time it takes Pierre to get to his office each morning, together with the uncertainty of being earlier or later than the average. Indeed, Pierre has used it to make probabilistic predictions of how long his journey will take — and was satisfied to find that his forecasts were accurate. Pierre’s model makes some important assumptions. To begin, it assumes that future days are drawn from the same distribution as was observed in the past. Provided there is no major change — a prolonged shutdown of the entire Métro system, interruptions to the city’s power supply, a strike — that is a safe assumption. As long as there’s continuity between the past and future, the model is reliable.
In addition to liking a reliable commute, Pierre also likes exotic vacations. Unfortunately, on a trip to Thailand he had a deadly accident. While seeking shade under a palm tree, a coconut fell on his head. Our unlikely hero was the victim of a highly unlikely event that we call “coconut uncertainty” — a kind of freak happening that you just can’t plan for. The truth is that most real-life situations are mixtures of subway and coconut uncertainty, which is precisely why coconut uncertainty interests us.
In technical terms, coconut uncertainty can’t be modeled statistically using, say, the normal distribution. That’s because there are more rare and unexpected events than, well, you’d expect. In addition, there’s no regularity in the occurrence of coconuts that can be modeled. And we’re not just talking about Taleb’s “black swans” — truly bizarre events that we couldn’t have imagined. There are also bubbles, recessions and financial crises, which may not occur often but do repeat at infrequent and irregular intervals. Coconuts, in our view, are less rare than you’d think. They don’t need to be big and hairy and come from space. They can also be small and prickly and occur without warning. Coconuts can even be positive: an inheritance from a long-lost relative, a lottery win or a yachting invitation from a rich client.
Pierre didn’t study psychology along with engineering and statistics. But if he had, he might have come across research showing that while people may be quite aware that rare events can occur, and may even be able to imagine several examples, they consistently underestimate the probability of at least one such event (including the ones they didn’t imagine) occurring.13 In other words, we tend to underestimate the size of the class of rare events. And that can lead to serious, sometimes mortal errors. Engineering disasters, for example, often arise because “fail-safe” systems crash due to the breakdown of only one previously unconsidered component.
Coconut Oil?
Now let’s look at a real-life example that affects us all: the price of oil. In 2008, the soaring price of oil reminded the world that there was such a thing as inflation, something that most Western economists had all but forgotten about. Consider the graph displaying daily changes in oil prices over a two-decade period.
Changes in Oil Prices, 1986-2008
The bars represent the numbers of days that daily changes in oil prices (expressed as percentages) had different values. The smooth curve (in the background) shows a theoretical normal distribution. It does not fit the empirical data, which have both many more outliers and values closer to the mean. The data are from the U.S. Energy Information Administration.
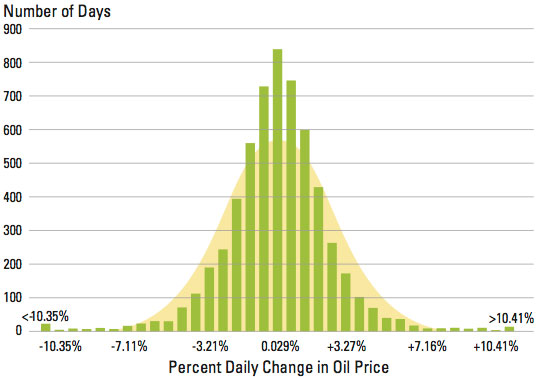
On first impression, the graph has a rather nice, symmetrical shape, with roughly the same pattern as many other daily series of data in economics and business. But it’s not the same shape as the normal distribution shown by the smooth pattern in the background. In particular, there are more extreme negative daily changes in the oil price — both up and down — than you would expect if the values were normally distributed. For example, between June 20 and October 11, 1990, oil prices went up 160%, from $26 to $67.30. By February 25, 1991, they were back down to $28. Throughout that period, there were vertiginous daily rises and falls, including several of the 13 values greater than 10.41% and the 21 lower than –10.35%, respectively. On the other hand, during the rest of the time (and maybe for a few days during more volatile periods, too), there were also more small rises than you would “normally” expect.
In short, oil prices don’t display nice, predictable subway uncertainty. Thus, people whose job it is to predict tomorrow’s oil price must cope with more coconuts than they might reasonably expect. And, as we saw above, the entire developed world is at the mercy of these lurking coconuts.
So what do economic forecasters do in such circumstances? Remember, it’s difficult — if not impossible — to model uncertainty that doesn’t follow known statistical models. Forecasters have traditionally done exactly what Pierre did. In practical terms, they have treated unexpected events, like the steep 1973-1974 oil price increase or the more recent rise of 2007-2008, as outliers that have to be ignored because they can’t be modeled.
Now, don’t get us wrong. The field of forecasting has produced excellent work over the years — both practical and academic. It has created models of subway uncertainty that can be assessed with remarkable precision and incorporated into all kinds of analyses to produce the best possible decisions. However, it’s just not set up to cope with coconuts, which are a fact of life in the real world of business. In essence, then, our message is: By all means make forecasts — just don’t believe them.
Juggling With Coconuts: The Three A’s
In the end, we admit that our message isn’t particularly positive. People still have to make decisions based on what they think will happen in the future. But we do have some advice for juggling with coconuts by using the three A’s: Accept, assess, augment.
Accept that you’re operating in an uncertain world. Psychologically, it’s tough, but ignoring uncertainty is not an option. In fact, whether your interest is in tomorrow’s oil price, next quarter’s sales data, next year’s stock price, earthquakes or simply getting to work on time, you can’t be realistic about assessing the chances of a given event occurring unless you first confront all the other possibilities that might come true instead.
Future-Perfect Thinking
Although people have great difficulty in predicting the future, they have little difficulty in explaining the past. Future-perfect thinking forces you to exploit hindsight (even if it is purely imaginary).iii
Here’s an example …
Assume you’re the CEO of a major airline, and in order to formulate your corporate strategy, you need to forecast oil prices for the next five years.
First, imagine that five years have already passed. You’re now able to look back on what happened over that period. It turns out that oil prices have been quite low and stable over the “past” five years, which was a great benefit to the airline (and your career). However, instead of just enjoying that imaginary good luck, explain — or tell the story of — how such favorable circumstances came about. What were the particular economic and geopolitical events that contributed to the low, stable oil prices?
Now, take a second trip forward five years on the time machine. This time, however, when you look back at oil prices, you are exasperated. All you see is mayhem: a period of steep and highly volatile prices that made running the airline almost impossible. Once again, explain what happened. What were the particular economic and geopolitical events that led to that painful scenario?
If you do that kind of exercise a few times, focusing on the realms of your own experience, you’ll start to develop a feeling for different futures and the fact that they are all plausible. Some of these futures will involve coconuts of different kinds and, though there is no formal technique for converting plausibility into probability, you can use your new insights to develop appropriate risk protection strategies. That is the essence of future-perfect thinking. It involves harnessing the clarity of hindsight to develop more vivid pictures of the future. It’s a way not only to accept, assess and augment the likelihood of a coconut hitting you on the head but also to devise a plan for coping with it in advance.
Assess the level of uncertainty you face. By all means, model your uncertainty as if it were subway uncertainty: Use a statistical model if you’re feeling mathematical, then consider how coconut uncertainty might come into play. Ironically, having accepted uncertainty, you can start to gather more data and judgments than you might otherwise have thought relevant. Take, for example, the sales of a first novel by an unknown author. It sounds like a unique case. But our suggestion to publishers is to ignore the uniqueness. Instead, look at the track
record of the sales of first-time authors in general. You have no valid reason to believe that the uncertainty surrounding your new author differs from the wider population of new authors that he or she belongs to — especially if you’ve used an industry standard process for collecting reader feedback (also known as human judgment). Therefore, you should have a reasonable estimate of just how low or high the sales might go. That range probably covers 95% of all possible outcomes. Done that? Well, now take the estimated range … and increase it! Hence the next step: Augment.
Augment the range of uncertainty. Chances are good that you’ve just underestimated the range of uncertainty, no matter how realistic you thought you were when you assessed it. Extensive empirical evidence shows that people consistently underestimate uncertainty — their powers of imagination are usually worse than their powers of mathematics. We have advice for those who’d like to stretch their imaginations, but if you’re not feeling creative, we have a rule of thumb.
Basically, our rule is: If you have a small amount of historical data that’s relevant for modeling the future, double the difference between the largest and smallest observations. Why? Well, to estimate a range accurately, you need to observe values at the two extremes. However, by definition, extreme values occur only rarely, so you’re unlikely to observe them in small samples.14 Doubling what you’ve observed in a limited number of past occurrences is a crude way of estimating, say, the 95% range.
On the other hand, if you have a wealth of past data (oil prices, for example), you may not need to double your range. However, we’d still recommend multiplying it by at least 1.5. Remember, as we saw earlier, people tend to underestimate the size of the class of potential coconuts, not to mention the size of the coconuts themselves.
From Forecasting to Planning
Given the number of disastrously bad forecasts — and not just in the last few years — it’s clear that businesses need a different strategy to cope with coconut uncertainty. As we saw with earthquakes and hurricanes, the key is not to develop precise plans based on predictions, but to have emergency plans for a variety of possibilities. If you live in Paris, it’s not necessary to plan for an earthquake or a piece of a satellite falling from the sky. But there are some actions you can take that can protect you from events you cannot predict. Indeed, many of us already do so by purchasing insurance or practicing fire drills in the workplace. Most insurance policies cover a wide range of potential disasters, and the evacuation techniques practiced for fire would be just as well suited for bomb scares, floods or gas leaks.
Exactly how you deal with uncertainty is for you and your team to decide. Perhaps you’ll use a hedging strategy or develop a plan B for evolving your business model. Or maybe you’ll take a “venture capital” approach to innovation, developing several new ideas at once, knowing that only one or two are likely to succeed. The main thing is to stop believing your own predictions about the future and to develop plans that will be sensitive to surprises, whether future credit crunches or other recessionary forces.
As coconuts go, the current economic crisis is a big hairy one from outer space. Will global, free market capitalism turn out to be another of those great political ideas that didn’t work in practice? We don’t know, but it’s interesting to speculate, and also important. In the end, the empire of capitalism will probably strike back, and it’s likely that the financial Jedi will return to preeminence (albeit, with powers diminished by regulation). Capitalism is not just a good idea — it can work in practice again. But this time we should learn from history about what we can and cannot predict.
References
1. See also, J. Surowiecki, “The Wisdom of Crowds” (New York: Anchor Books, 2005).
2. “Paulson Says He’ll ‘Do What It Takes’ to Calm Markets,” Mar. 16, 2008.
3. G.W. Bush/press conference, James S. Brady Press Briefing Room July 15, 2008.
4. H.M. Paulson, “Paulson Testimony on Turmoil in U.S. Credit Markets,” Sept. 23, 2008.
5. “Talks Implode During a Day of Chaos; Fate of Bailout Plan Remains Unresolved,” New York Times, Sept. 26, 2008.
6. International Monetary Fund, “World Economic Outlook 2007: Spillovers and Cycles in the Global Economy” (Washington, D.C.: IMF, April 2007).
7. International Monetary Fund, “World Economic Outlook” (Washington, D.C.: IMF, October 2007).
8. International Monetary Fund, “World Economic Outlook” (Washington, D.C.: IMF, April 2008).
9. International Monetary Fund, “World Economic Outlook 2008: Financial Stress, Downturns, and Recoveries” (Washington, D.C.: IMF, October 2008).
10. J.C. Cooper, “No Recession, But …,” BusinessWeek (Dec. 20, 2007).
11. N.N. Taleb, “The Black Swan: The Impact of the Highly Improbable” (New York: Random House, 2007).
12. S. Makridakis, R.M. Hogarth and A. Gaba, “Dance With Chance: Making Luck Work For You” (Oxford: Oneworld Publications, 2009).
13. A. Tversky and D. Kahneman, “Judgment Under Uncertainty: Heuristics and Biases,” Science, New Series 185, no. 4157 (Sept. 27, 1974): 1124-1131.
14. That also applies to samples that are imaginary. See P. Juslin, A. Winman and P. Hansson, “The Naïve Intuitive Statistician: A Naïve Sampling Model of Intuitive Confidence Intervals,” Psychological Review 114, no. 3 (2007): 678-703.
i. S. Makridakis and M. Hibon, “The Accuracy of Forecasting: An Empirical Investigation,” Journal of the Royal Statistical Society, Series A, 142, no. 2 (1979): 97-145.
ii. S. Makridakis, A. Andersen, R. Carbone, R. Fildes, M. Hibon, R. Lewandowski, J. Newton, E. Parzen and R. Winkler, “The Accuracy of Extrapolation (Time Series) Methods: Results of a Forecasting Competition,” Journal of Forecasting 1, no. 2 (September 1982): 111-153; and S. Makridakis and M. Hibon, “The M3-Competition: Results, Conclusions and Implications,” International Journal of Forecasting 16, no. 4 (October-December 2000): 451-476.
iii. For a further application of this method, see T.S. Pitsis, S.R. Clegg, M. Marosszeky and T. Rura-Polley, “Constructing the Olympic Dream: A Future Perfect Strategy of Project Management,” Organization Science 14, no. 5 (September-October 2003): 574-590.
Comments (2)
JT Cooper
Eva van Bodegraven