Measuring Brand Health to Improve Top-Line Growth
Contrary to conventional wisdom, there is a key set of fundamental metrics — which can be actively managed — linking the health of brand to revenue and consumer commitment.
Topics
Executives like to talk about strong brands as platforms for sustained growth. In the management literature, the link between brand equity and shareholder value is well accepted. So, why is the responsibility for brand-building not more actively managed in the executive suite?
In our work across sectors, we see companies often failing to “walk the talk” — unable to grasp the link between brand health and revenue commitment from customers. They treat brand-building superficially, believing that what matters is making brute-force impressions through large advertising campaigns.1 Yet brand health is based on more than image and, through a set of key interrelated measures, can be linked to business performance.
How does the concept of brand health compare to the notion of brand equity?2 Brand equity is linked to shareholder value.3 It is an intangible, long-term measure of a company, which is of little use to executives making investment trade-offs that affect top-line growth. By contrast, brand health is linked to current and future value with consumers and differences in competitive position. It is tangible and vital to managing brands and business performance on a forward-looking basis.
To measure brand health — and, contrary to conventional wisdom, it can be measured — is to obtain a 360-degree view of a brand in its marketplace, a wide-angle view of consumers and competitors. What is required is isolating underlying elements that matter, measuring them and linking them to business performance. “Companies don’t work hard enough to understand the dimensions, even while extolling the importance of brand,” says Charles M. Lillis, a director of Washington Mutual, SUPERVALU, Williams Companies and Medco.
Sustaining active brand management confers prime benefits for most companies. Our work, based on data gathered from over 7,000 consumers about 11,000 customer-provider relationships across large sectors of the U.S. economy, shows a statistically significant correlation between brand health and sales. The healthiest brands have twice the amount of customers reporting increasing spending than the worst-performing brands.
These findings, and the manageable metrics they suggest, will allow marketers and investors to “connect the dots” between key elements of brand health and business performance and to reconcile previously separate notions: brand and operations, the short term and the long term, investment and return. In this article, we offer a statistically reliable set of brand-health elements for companies to measure and to use as leading indicators of sales risk and potential. (See “About the Research.”)
Brand Management: Where Companies Go Wrong
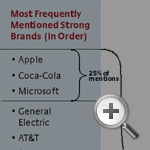
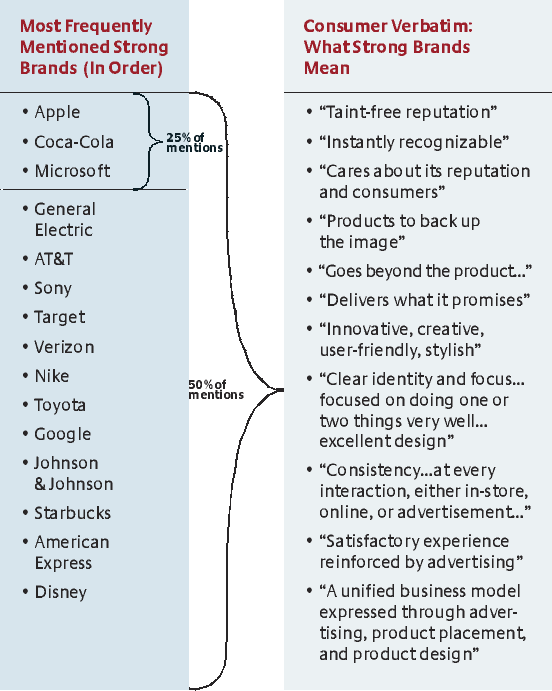
In the course of our research, we asked consumers to name strong brands. The list of brands most mentioned was short, reinforcing the point that brand-building is underdeveloped in most companies. (See “What Consumers Say About Strong Brands.”) Only 15 brands accounted for 50% of total mentions. Consumers set a high bar for brands to qualify as strong, and strength appears to be based on more than company image or size. Brands are viewed in multiple dimensions — encompassing a consumer’s cumulative perceptions and experiences.4
At a minimum, strong brands are visible, but awareness does not in itself constitute strength.
Developing a powerful brand across multiple dimensions and blending its creative and operational aspects requires active management.5 (See “The Strategic Importance of Brand Health.”) We find, however, that most companies view brands and brand management rather narrowly and passively:
They fixate on brand awareness.
Advertising alone does not build a brand. On the contrary, our data show that aided awareness is only weakly correlated with brand health and customer commitment. “It’s not just about what you say, but what you do as a company [to build a brand],” warns Len Vickers, the former head of corporate marketing at General Electric Co.
Consider the grocery industry: Traditional grocers have among the highest awareness ratings and the lowest percentages of customers increasing spending. In the wireless and banking industries, consumers rank advertising last among factors most influencing their impressions of a brand. Advertising accounts for less than 5% of what drives brand impressions. Consumers rate product quality in wireless (for example, network coverage) and the banking experience (for example, branch service) as four times more influential.
Advertising can be inadvertently brand-diluting. In many companies, the line item of advertising includes promotion, which is unrelated to brand-building and can even erode the brand. In these cases, ironically, advertising can contribute to attracting lower-value, price-sensitive customers.
They neglect customer satisfaction.
Customers are not passive participants in the making of brands.6 In fact, across sectors, we found customer satisfaction to be the strongest determinant of brand health. It is also the only common, statistically significant driver of current revenue and growth prospects in the customer-provider relationship.
Companies with strong brands realize that brand-making is an interactive process between company and consumer. These companies don’t subscribe to the traditional notion that branding is a “creative” endeavor, while satisfaction is only a function of operational efficacy. Look at Starbucks Corp. of Seattle, Washington. In his book,Pour Your Heart Into It: How Starbucks Built a Company One Cup at a Time, Chairman Howard Schultz explains: “The most powerful and enduring brands are built from the heart … not an ad campaign. Customers choose to come to us for our coffee, our people and the experience in our stores. Mass advertising can help build brands, but authenticity is what makes them last.”7
They assume current sales are a gauge of future relationship potential.
We found sales to be a lagging indicator of customer commitment and an unreliable predictor of relationship potential. In the wireless industry, for instance, a customer’s current monthly spending is statistically unrelated to “stickiness” or growth in the customer-provider relationship. The same holds for banking — a customer’s current deposit level is no guarantee of a future, growing relationship.
A preoccupation with current sales can mask trouble with a brand. For instance, one traditional grocer that ranks first or second in total sales across nine major markets nevertheless ranks in the bottom half of competitors on brand health and percentage of customers increasing spending in its stores. Similarly, in banking, two of three top national banks (as measured in deposits) have the lowest brand-health scores of major banks in key East and West Coast markets studied and double the number of customers likely to switch compared with the healthiest brand.
They allow their brands to drift.
Our data show that better brand health through active management can lead to statistically different levels of competitive advantage — including inordinate shares of the most valuable customers. Trader Joe’s Co., a specialty grocery chain based in Monrovia, California, for example, excels at satisfaction and distinctiveness — and as a result has more high-spend, “food-engaged” shoppers and fewer price-sensitive promotion seekers relative to Wal-Mart Stores Inc. and some of the larger chains. But Trader Joe’s is in the minority. “Most companies just let their brand image evolve, instead of actively managing it,” says Lillis.
The Key Elements of Brand Health
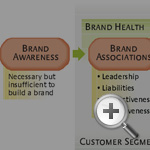
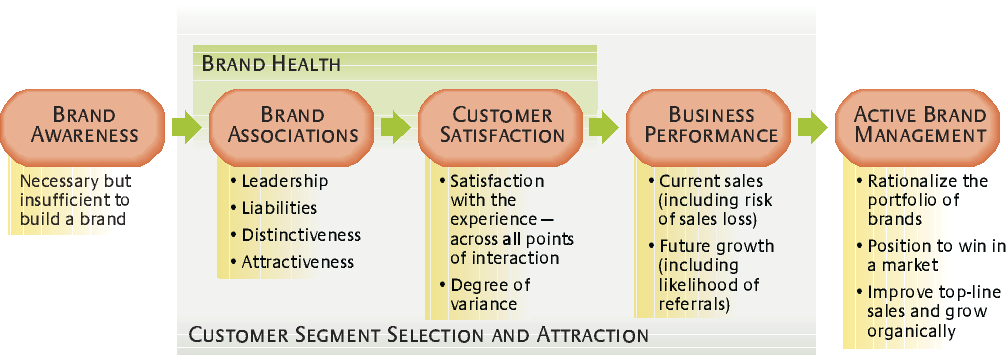
Brands should not and need not drift. We have identified five key elements of brand health that form a statistically reliable core set of measures. Although all five elements are recognized in the management literature,8 they have not heretofore been intercorrelated, tested through empirical data and offered as a core set of brand-management metrics. In our aggregate framework, they provide common benchmarks for executives and investors looking to grade and guide brand performance and spur action company-wide. (See “The Interrelated Elements of Brand Health.”)
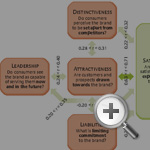
Each element offers a unique measurement perspective:
Leadership measures the availability of a brand, its reputation and points of presence. It answers the question: Do consumers see the brand as available to serve them now and in the future?
Liabilities measure a brand’s vulnerabilities, or negative associations, and consumer reluctance. What is limiting commitment to the brand and repelling consumers?
Attractiveness, by contrast, measures the extent of positive associations with a brand. As such, it asks: Are customers and prospects drawn toward the brand?
Distinctiveness measures the perceived relevance of a brand — does it break the perception of parity in a customer’s mind? Do consumers perceive the brand to be “set apart” from competitors?
Satisfaction is a measure of performance against customer expectations. It answers the question: Are customers satisfied with their experience with the brand?
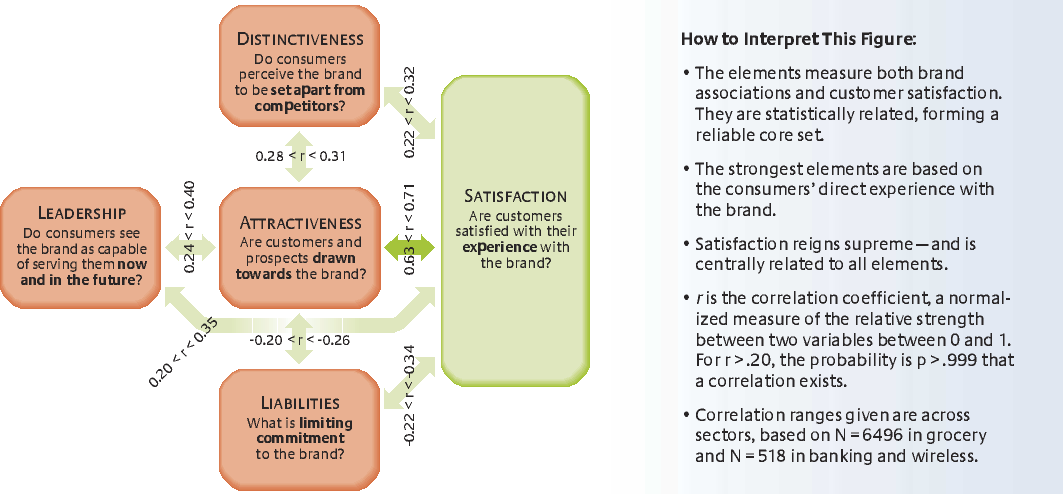
The elements are interrelated to a greater or lesser degree statistically, as follows:
- Satisfaction is centrally related to all elements and has some of the strongest correlations. Its dominant influence reflects the rising importance of the customer experience on brand health. It also suggests that companies need to push past image and product-only thinking when it comes to brand-making.
- Attractiveness is most strongly related to satisfaction — not to leadership. Thus, a customer’s experience with a brand is the method by which positive associations are built. Being attractive and accruing positive associations also seems to insulate brands from liabilities.
- Distinctiveness is also related to satisfaction and attractiveness and not to leadership. This correlation pattern suggests that distinctiveness is more a measure of the personal relevance of a brand than company-level differentiation per se.
- Leadership too is associated with satisfaction and attractiveness, confirming that brand health is not built on sheer availability or reputation. Leadership is unrelated to distinctiveness andliabilities. Size alone does not add to perceived uniqueness or lack ofliabilities.
Linking Brand Health to Customer Commitment
We were able to isolate four revenue-related expressions of customer commitment. Two apply to current sales — current customer spending and risk of sales loss — and two apply to future growth — revenue momentum and likelihood of referrals. Each adds to a view of customer-provider relationship potential.
Current customer spending.
A customer’s current amount of spending with or commitment to a company is affected by breadth of product penetration and share of wallet — and a historical reflection of customer value.
Risk of sales loss.
This risk equates to the loss of revenue to competing alternatives based on a customer’s likelihood to cross-shop or switch providers.
Revenue momentum.
This is based on the actual and anticipated increases in spending or commitment over time and on intent to purchase additional products.
Likelihood of referrals.
Referrals reflect positive promotion by individual consumers, increasing the likelihood of adding new customers or sales. Across sectors, referrals equate to word-of-mouth promotion by satisfied customers.
How do the brand-health elements relate to the above four expressions of customer commitment?
Customer satisfaction has the greatest impact on both current sales and future growth. (See “The Impact of Brand Health on Business Performance.”) High satisfaction delivers virtuous economic outcomes. In the wireless industry, for example, Verizon Communications Inc.’s higher satisfaction scores have yielded customers that are statistically more likely to subscribe to a broader array of revenue-generating features and applications (such as data and multiple numbers), intend to stay with and follow Verizon into new product areas (such as broadband Internet) and refer Verizon to others.

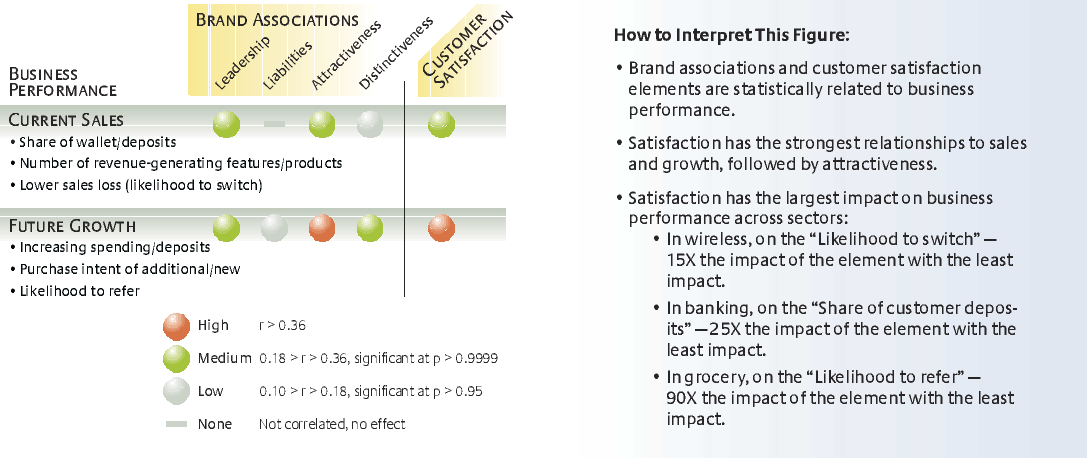
Across sectors, satisfaction is the only common significant driver with an impact on sales. In banking, for instance, it is the main driver of current sales, and the effect is 25 times greater than the effect of the smallest but still significant effect of leadership.
Satisfaction also matters in mitigating the risk of sales loss. The effect is stronger in some sectors than others and is based on the stickiness of the relationship. In the wireless industry, where subscribers have contracts, the impact of satisfaction on reducing risk is eight times that of the smallest but still significant element of distinctiveness. In banking, the impact of satisfaction is even stronger (15 times). In the grocery industry, a nonsubscription business, sales loss includes revenue erosion from cross-shopping. Leadership helps to mitigate this risk but may prevent executives from seeing sales erosion as a function of dissatisfaction or liabilities.
Wal-Mart, for example, has a leading share position in U.S. food sales but also a high percentage of perceived liabilities. When it comes to future growth, satisfaction and attractiveness are the key determinants across sectors. Leadership has the least significant impact. For example, relative to traditional grocers such as Wal-Mart and Whole Foods Market Inc., based in Austin, Texas, Trader Joe’s rates lowest on leadership but highest on satisfaction. Interestingly, Trader Joe’s has the largest percentage of customers increasing spending over the last two years.
Brands regarded as more distinctive by customers have greater permission to cultivate demand and “stretch” into new areas. In the wireless industry, distinctiveness is correlated with a customer’s willingness to consider buying both new offers related to mobility (such as music and video downloads) and adjacent offers (such as broadband Internet access at home and cable video services). A brand’s ability to break the perception of parity in a customer’s mind is key to growth in the customer-provider relationship.
Finally, though all brand-health elements have some significant impact on referrals, satisfaction once again dominates. The greatest impact is in the grocery industry, where the effect of satisfaction on referrals is 90 times that of leadership. Attractiveness follows satisfaction with the next largest impact but with only one-tenth the effect in the wireless and grocery industries and one-quarter the effect in banking.
How to Practice Active Brand Management
Monitored together, the elements of brand health and indicators of customer commitment reveal a company’s market position — its opportunities and vulnerabilities. Such data provide a platform for active brand management and companywide action to rationalize the portfolio of brands, position them to win in a market, improve top-line sales and grow organically.
Rationalize the Portfolio of Brands
To measure brand health across a portfolio9 of brands is to ask: “How do our brands compare?” What results is a snapshot that can be de-averaged (for example, by customer segment and at different levels of brands such as brand families or products) and rolled up and down across geographies (for example, by trade area, sales region or metropolitan statistical area). Such comparative intelligence can shape thinking about brand investment trade-offs: Which brands have momentum? Which are withering on the vine? Which brands need pruning because they have lost relevance with valuable segments? Which brands can stretch across several segments? How is performance changing over time, or not?
For instance, comparative grocery-industry data show brand variance and inconsistency within and across individual grocers. One traditional grocer’s overall average customer-satisfaction scores vary across its portfolio of banners — by 34% across geographic markets and 67% across individual customer segments. What’s more, the standard deviation of its satisfaction scores reflecting store-to-store variance within markets is 3% to 56%, greater than the least varied competitor in 14 markets studied. The perception of this chain as distinctive is similarly uncontrolled, with a 3.5 times bottom-to-top range on percent of customers viewing the brand as distinctive across markets. All those variances leave the door open for focused competitors.
In the banking and wireless industries, comparative data reveal a brand’s potential to extend, or not, into new areas. Moving into banking, a leading indicator of Capital One Financial Corp.’s potential success is brand data comparing the health of Capital One with that of its acquired brands, Hibernia and North Fork, and its competitors in Louisiana and New York. In the wireless industry, brand-health data can help determine the brand advantage for a company such as Verizon offering wireless only or wireline plus wireless in a given metropolitan statistical area. As it turns out, Verizon’s brand health is higher in New York City, where both services are offered, than in San Francisco, where only wireless is offered.
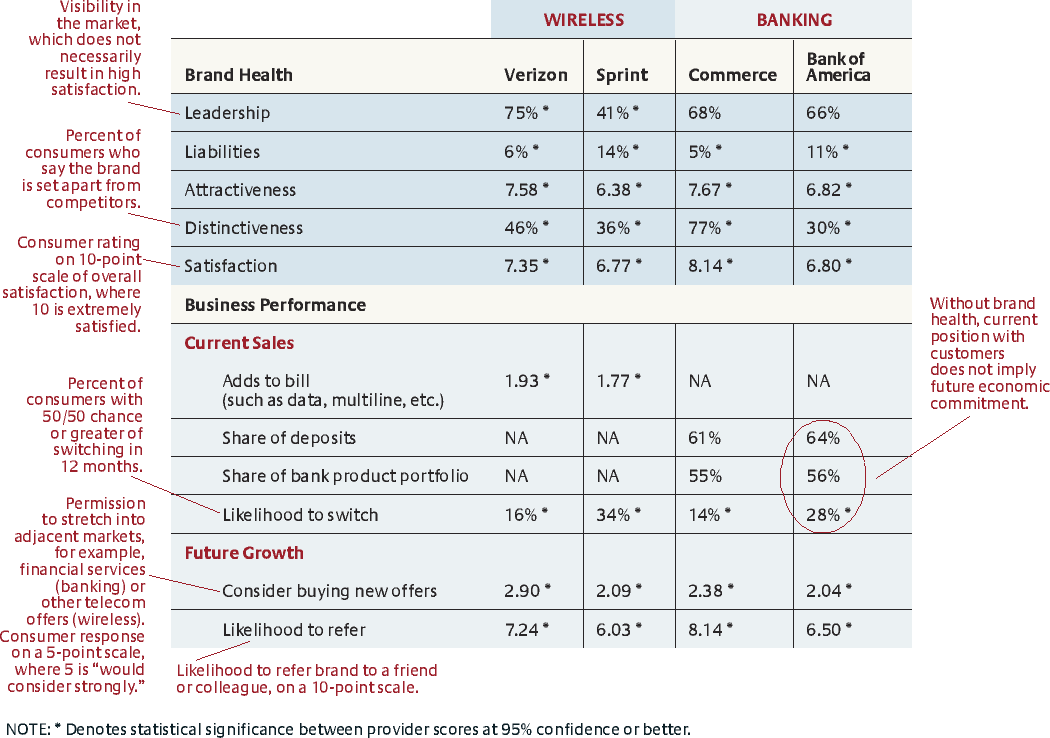
Position to Win in a Market
Measuring the impact of brand health on business performance puts brand-making squarely in the realm of competitive strategy. (See “The Impact of Brand Health on Business Performance in Wireless and Banking.”) In the wireless industry, Verizon is a benchmark for Sprint Nextel Corp. in terms of performance gaps for Sprint to close and aspects of Verizon’s strengths to counter as well as vulnerabilities to exploit. In banking, the brand health of Bank of America Corp. versus Commerce Bancorp Inc., a relative newcomer, implies a warning for highly visible, high-share brands. Leadership does not necessarily translate to satisfaction, and current standing with customers does not ensure future economic commitment.
When de-averaged by customer segment, competitive brand health comparisons can also answer customer selection and attraction questions, including: Where does my brand stand with the most valuable customers? What is the gap in my brand position between customers and prospects? Are segment-targeting assumptions, embedded in our market strategy, consistent with our brand health reality?
Across segments, brand-health data can be used to gauge the limits of a brand. For instance, facing focused competitors such as Costco Wholesale Corp. of Issaquah, Washington, and Whole Foods Market, traditional grocery chains need to consider if and how they will satisfy unique customer segments by stretching their core brand. Or should they introduce a new, potentially competing brand? Geography-specific brand-health intelligence at the segment level is crucial for companies like The Kroger Co., a grocery chain based in Cincinnati, Ohio, that need to place and position multiple brands in different areas.
Improve Top-Line Sales and Grow Organically
Active brand management, based on measuring brand health, can allow companies to better control sales10 and growth. Customers do spend and intend to spend more with brands they see as healthier. Grocery customers spend a greater percentage of their weekly budget with a healthy brand, and they are more likely to shop in high-spend categories such as meat and produce. Bank customers have more relative deposits and products such as loans, investments and small business accounts with healthy brands. Wireless customers boost their monthly bills with more revenue-producing additions, such as data and family plans, and new applications like games and music with healthy brands. Customers of healthy brands are less likely to switch or shop alternatives.
For a market strategist, active brand management provides the platform for increasing consumer acceptance of new products and brand extensions. Healthy brands can stretch further and into large adjacent markets: from banking to financial services, from wireless voice to mobile voice, from information to entertainment. Our data show customers are more likely to consider their bank or wireless provider for extended products and services based on positive brand associations and satisfying experiences.
Getting It Right at Your Company
To diagnose your company’s capacity for active brand management with brand-health measurement at the core, consider the following seven questions:
Is your brand fulfilling the addressable market?
Companies mistakenly define markets too narrowly, missing brand opportunities. Instead, start with your consumers — what are their problems to be solved?11 In the grocery industry, for example, some traditional brands are missing opportunities in convenience-food categories — even though we found that 36% of consumers “would buy take-out from a grocery store if it offered what [they] wanted.” Take a wide-angle view of your addressable market opportunity through the eyes of consumers and rely on brand-health measures to help shape a fulfilling market position.
Can you define your brand position distinctively?
The essence of brand positioning is sacrifice: What are you willing to stand for, and what are you willing to give up? Brand distinctiveness is key to brand health. What does your brand mean to consumers? Do consumers believe that you care what they think of your brand? In banking and wireless, between 26% and 34% of consumers said their providers do not. Consumers need to see your brand as “set apart.” Can you articulate your brand position in a simple, powerful statement?
Does marketing = branding = advertising in your company?
Using these terms interchangeably will lead to shortchanging your brand. Active brand management requires companies to synchronize, but not collapse, these complementary but rarely differentiated functions across companies. Clarify responsibilities: Who is the architect of your company’s market strategy? Who defines the brand promise? Who defines customer-value propositions to support and reinforce the brand promise?
Is branding being “off-shored” to your advertising agency?
Given the confusion surrounding marketing, branding and advertising plus the absence of strong leadership, branding gets outsourced to agencies. “Companies expect advertising to do too much heavy lifting and [they] gloss over product and operational deficiencies,” says Brian Morris, former CEO of Dailey & Associates Advertising of West Hollywood, California. Companies go wrong when they fixate on advertising alone. The essence of branding should never be delegated.
If customer satisfaction is breaking down, who calls the meeting?
In your company, who leads — and has the last word — on defining and guiding the customer experience? Delivering on a brand’s promise does not fit neatly into an organizational silo12; someone needs to lead the charge. The responsibility belongs in the executive suite with the chief marketing officer. CMOs need the power to lead up, down and across an organization with direct influence over operations that affect the entire customer experience.
Does brand-related tracking and budgeting go beyond advertising and promotion?
Brand-making requires companywide resources. Brand-health measures need to be elevated — added to the executive “dashboard” as leading indicators predicting future revenue streams.13 As such, they should be systematically reviewed by the executive team and the board considering investments using a “capital allocation mindset.” Know what will move the needle on brand health, and invest in what matters.
Do you understand that brand-making is a marathon and not a sprint?
Surprisingly, few brands appear be set up for the long haul. We found that in the wireless and banking industries alone, less than 20% of customers say their providers value their long-term business. Measuring brand health gives you a view of forward momentum — keeping the brand position relevant by staying ahead of constantly shifting customer needs and competitive pressure. Active brand management is a journey that never ends.
References
1. P.F. Nunes and J. Merrihue, “The Continuing Power of Mass Advertising,” MIT Sloan Management Review 48, no. 2 (winter 2007): 63–69.
2. P.H. Farquhar, “Managing Brand Equity,” Marketing Research 1 (September 1989): 24–33; and K.L. Keller, “Conceptualizing, Measuring, and Managing Customer-Based Brand Equity,” Journal of Marketing 57, no. 1 (January 1993): 1–22.
3. T.J. Madden, F. Fehle and S. Fournier, “Brands Matter: An Empirical Demonstration of the Creation of Shareholder Value Through Branding,” Journal of the Academy of Marketing Science 34, no. 2 (April 2006): 224–235.
4. P.B. Berthon, M.B. Holbrook, J.M. Hulbert and L.F. Pitt, “Viewing Brands in Multiple Dimensions,” MIT Sloan Management Review 48, no. 2 (winter 2007): 37–43; and K.L. Keller, “Brand Synthesis: The Multidimensionality of Brand Knowledge,” Journal of Consumer Research 29, no. 4 (March 2003): 595–600.
5. D. Aaker, “The Power of the Branded Differentiator,” MIT Sloan Management Review 45, no. 1 (fall 2003): 83–87; and K.L. Keller and S. Sood, “Brand Equity Dilution,” MIT Sloan Management Review 45, no. 1 (fall 2003): 12–15.
6. S. Fournier and D.G. Mick, “Rediscovering Satisfaction,” Journal of Marketing 63, no. 4 (October 1999): 5–23.
7. H. Schultz and D.J. Yang, “Pour Your Heart Into It: How Starbucks Built a Company One Cup at a Time” (New York: Hyperion; 1997): 248–249.
8. T.J. Reynolds and C.B. Phillips, “In Search of True Brand Equity Metrics: All Market Share Ain’t Created Equal,” Journal of Advertising Research 45, no. 2 (June 2005): 171–186.
9. S. Hill, R. Ettenson and D. Tyson, “Achieving the Ideal Brand Portfolio,” MIT Sloan Management Review 46, no. 2 (winter 2005): 85–90.
10. K.L. Ailawadi, D.R. Lehmann and S.A. Neslin, “Revenue Premium as an Outcome Measure of Brand Equity,” Journal of Marketing 67, no. 4 (October 2003): 1–18.
11. C. Christensen, S.D. Anthony, G. Berstell and D. Nitterhouse, “Finding the Right Job for Your Product,” MIT Sloan Management Review 48, no. 3 (spring 2007): 38–47.
12. D. Stiff, “So You Think You Know Your Brand,” MIT Sloan Management Review 47, no. 4 (summer 2006): 95–96.
13. K.L. Keller, “The Brand Report Card,” Harvard Business Review 78, no. 1 (January–February 2000): 26–35.