Using the Interactive Charts
Explore and customize the interactive dashboard by filtering the data that is useful to you — and creating a customized visualization to share.
Learn more about:
Data Customization
Use the drop-down menus in the control module at the top left of the dashboard to discover the information most relevant to you.
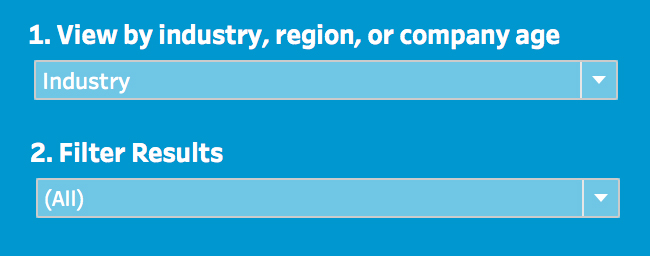
1. View by industry, region, or company age allows you to set a filtering parameter to view results by industry, geographic region, or how long an organization has been operating.
2. Filter Results options allow you to drill down to the specific segment of data you are interested in viewing.
Saving Your Customized Visualizations
After you’ve applied filters and other customizations to an interactive chart, you can download a PDF of your customized view using the download buttons in the control module.
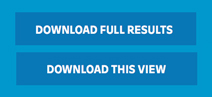
Download Full Results will download a PDF that includes all survey records, unfiltered.
Download This View will download a PDF with the data you have filtered with the control panel.
*Please note: These visualizations were intended to show trends in responses. Small discrepancies may be due to rounding errors.
Share or Embed the Interactive Chart
You can share the interactive chart — either the view you created or the original view — with your network or on your site by using the share tools  in the bottom left-hand corner of the visualization. There are options for linking to your Facebook and Twitter, and for embedding it into your own website.
Please note: All data is copyright Massachusetts Institute of Technology. When citing the material, credit MIT Sloan Management Review and Deloitte, and link back to the report at https://sloanreview.mit.edu/digital2018.
Reverting the Chart to Original View
Use the revert, undo, or redo buttons on the bottom left-hand corner of the chart’s footer to reset the data to its default state. This will undo any customization you’ve done to the chart.

Downloading the Raw Data
You can download the data as an Excel file to view in Microsoft Excel and other applications.
Disclaimer: The data is provided “as is.” The user assumes the entire risk related to its use of this data. MIT Sloan Management Review and Deloitte make no representation or guarantee with respect to data provided by either Party for further use by third parties.
* Please note: These visualizations were intended to show trends in responses. Small discrepancies may be due to rounding errors.
About the Data
In the fall of 2017, MIT Sloan Management Review, in collaboration with Deloitte, captured insights from over 4,300 individuals in 123 countries and 28 industries, from organizations of various sizes. More than two-thirds of the respondents were from outside of the United States. The sample was drawn from a number of sources, including MIT Sloan Management Review readers, Deloitte Dbriefs webcast subscribers, and other interested parties.
You can download the raw data (.xlsx) to view in Microsoft Excel and other applications.
Digital Maturity
We asked respondents to “imagine an ideal organization transformed by digital technologies and capabilities that improve processes, engage talent across the organization, and drive new value-generating business models.” We then asked respondents to rate their company against that ideal on a scale of 1 to 10. Three maturity groups were observed: “early” (1-3), “developing” (4-6), and “maturing” (7-10). Read the full report to learn more about digital business maturity.
Read the Research Report

Collaborating Sponsor
