Improve Data Quality for Competitive Advantage
During the past several decades, managers have expended great effort to stay abreast of the latest information technologies (IT). Despite this, managers still do not have the accurate, timely, and useful data they need to be effective. Data failures are embarrassing and costly. Recent published examples include lawsuits filed to protect consumers from incorrect credit reports, incorrect payment of municipal taxes, and rebates due to incorrect product labeling. No industry — communications, financial services, manufacturing, health care, and so on — is immune. Nor is government.
We at AT&T Bell Laboratories QUEST have initiated a broad-based program to determine the root causes of poor quality data and develop simple, effective strategies for mitigating them.1 Our ultimate goal has been to improve data and information quality by orders of magnitude and create an unprecedented competitive advantage. We have found that:
- Many managers are unaware of the quality of data they use and perhaps assume that IT ensures that data are perfect. Although poor quality appears to be the norm, rather than the exception, they have largely ignored the issue of quality.
- Poor quality data can cause immediate economic harm and have more indirect, subtle effects. If a financial services company cannot get my social security number right, I will seriously question its ability to manage my money. Mistrust grows when the data from one department, say, order entry, and used by another, say, customer billing, are flawed.
- Poor data in financial and other management systems mean that managers cannot effectively implement strategies.
- Inaccurate data make just-in-time manufacturing, self-managed work teams, and reengineering infeasible. The right data need to be at the right place at the right time.
- Due largely to the organizational politics, conflicts, and passions that surround data, only a corporation’s senior executives can address many data quality issues. Only senior managers can recognize data (and the processes that produce data) as a basic corporate asset and implement strategies to proactively improve them.
The relatively simple strategies I present here are directly applicable to all data-intensive industries. Their conscientious implementation can vastly improve data quality. At AT&T, the focus on data has led directly to reengineering opportunities and reduced costs. In particular, programs with suppliers (local telephone companies) have greatly improved the quality of bills, at reduced cost to both the supplier and data user. Telstra Corporation, the telecommunications company in Australia, is emphasizing improvements to data quality to help improve service.
We suggest three strategies for improving data quality; the first and second support later strategies. The first step, obviously, is to identify the problem; data quality cannot be improved unless the problem is first recognized. Unfortunately, few corporations actively measure data quality. However, we have found several relatively simple indicators that most senior managers find easy to apply.
The second step is to treat data as an asset. While virtually everyone agrees that data are critically important, few corporations manage them as such. Since data are so short-lived, the processes that create or obtain data are as much an asset as the data.
The third step is to implement more advanced quality systems. Many corporations spend enormous amounts of money finding and fixing bad data. Advanced quality systems aim at the processes that create data. Specifically, process management techniques applied to data yield superior results.2
Identify Poor Quality Data
Awareness of the extent and impact of errors in data is growing.3 Computerworld and InformationWeek have surveyed large businesses and readers and conclude that the majority of organizations are plagued by data-quality problems.4 There is general agreement that poor quality data are costly, but there are relatively few studies of quality statistics.5 The literature confirms the low accuracy rates cited in the news and trade articles.6 Astounding as the statistics are, they reflect only the accuracy dimension of data quality. They do not reflect other potential data-quality issues such as relevancy, consistency, and so forth.7 My focus is on the most fundamental issue of data accuracy.
We know of no corporation that regularly measures data quality (although Telstra is beginning to do so). While individual database owners are well advised to measure quality, managers need not rely on measurement to detect poor quality; they can also detect it if the organization is doing extensive data inspection and rework, has redundant databases, is unable to implement strategy, or exhibits frustration with IT.
Extensive Data Inspection and Rework
The first, and most reliable, indicator of poor quality data is if the company is extensively inspecting and correcting data. For example, when AT&T purchases so-called access from local telephone companies, it receives the bills and pays them promptly.8 At the same time, it verifies the accuracy of each bill by constructing, from its own data, a “predicted bill” (see Figure 1). It then compares the predicted and actual bills and refers discrepancies to a claims process for correction. Claims can lead to rework, rebates, and, sometimes, counterclaims. Each company bears significant expense because of mistakes in the original bill. The local telephone company incurs added expense from responding to claims, issuing rebates, and so on. Perhaps more important, the company can never be sure that it is not significantly underbilling. And AT&T must, in effect, maintain its own billing system (for generating predicted bills), operate the system for comparing bills, and manage claims. Industrywide, this amounts to tens of millions of dollars from the companies’ bottom lines. The nonquantifiable costs, due to delayed book closings and increased ill-will, may be greater.
The “company” shown in Figure 1 may be an internal organization, such as sales and manufacturing or order entry and billing, and the “compare,” “claims,” and “respond” may be inspection and correction of bad data in some form. Such situations also increase cost. In one study, we found that 6 percent of the downstream organization’s cost was directly attributable to poor data from the upstream organization.
Multiple or Redundant Databases
The second indicator of poor quality data is redundant data and multiple processes to create them. For example, the engineering department at a manufacturing facility I visited had two discrepant databases, one owned by engineering, the other by purchasing. Engineering wanted to eliminate discrepancies and, to its credit, keep them from returning. In the past, there had been only one database, but each group had blamed the other for poor quality data. Each concluded that it needed its own database to control. But, as neither group was particularly adept at creating good data, the quality of data in each database was no better than the original.
Inability to Implement Strategy
The third indicator is the lack of quality data for implementing strategy and/or reengineering. The comments of one executive, frustrated by inaccurate data, provide a good example: “In our corporation, each unit makes P/L commitments to the chairperson. In the fall, we get agreement on those commitments for the following year. Then we develop and implement plans to meet those commitments. And early each month, we get summaries of the previous month’s and year-to-date progress toward those commitments. So if we’re not on target, say, in February, I can adjust my strategy to meet my commitment.
“But I don’t really get January results in early February. For example, I simply don’t know what my true expenses are. Instead, I get an estimate or forecast. Let’s suppose the January forecasts show I’m on track. January ‘actuals’ trickle in for many months. Not until July, do finally I close the books on January. Sometimes in July I’ll receive a real January expense that is nowhere near the forecast. Now I’m way off track in meeting my commitments, and, since half the year is gone, I have virtually no chance of adjusting my strategy in any significant way. Of course, I may get lucky. The February actuals, which I finally close in August, may make up the difference. And I may even exceed my commitment. But even when I’m lucky, this is no way to run the business.”
Similarly, new organizational structures and reengineering require vast amounts of data. IT’s entire purpose is to get data where it is needed when it is needed. But if the data are of poor quality, it is difficult to derive much benefit from IT and/or to reengineer (of course, you can make mistakes faster).9
Frustration with IT
The fourth indicator of poor quality is individual or organizational frustration with data, data suppliers, and IT. There is a natural human tendency to assume that “if it’s in the computer, it must be right.” This is especially true for people who do not know how the data were produced. Thus, as less experienced users acquire greater access to data, they are more easily victimized by bad data.
Customers, even generally tolerant ones, are especially angered by poor quality data that affect them personally and directly; the employees who must interact with those customers feel the impact. Denying credit to a potential buyer because of incorrect data lowers future sales. And poor quality data can lead to litigation, as in the credit reporting industry.
Reactions of people within a corporation are similar. For example, the billing department may bear a certain amount of animosity for the order-entry group. Managers should ask people who depend on data simple questions like: How good are our data? What do you do if the data are wrong? How often does this happen? Some may recognize the problem easily; some may direct their frustration at other departments — “those #90@&# in order entry” or this “#%@6# computer system.”
Treat Data as an Asset
The quality of data is directly related to its value to the corporation, but few managers treat data as an asset. While a comprehensive theory for managing data has yet to emerge, there are a few simple, yet powerful, practices:
First, develop an inventory of data assets. Most companies see people as an important corporate asset. Can you imagine a corporation that does not know how many people it employs, where they are located, what they are doing, their general knowledge level, the turnover rate, and so forth? The equivalent questions for data are: How much do we have? Where are they located? How much are redundant? What are their quality levels? How fast do the data turn over? What processes create this data? How good are they? How do we use the data?
Second, ask what sort of asset data is. Most organizations view and manage data as the “stuff stored in those big databases.” Data are tremendously dynamic, being created, stored, manipulated, transmitted, reformatted, used, and becoming outdated, at astonishing rates. Corporations must recognize data’s dynamic nature and the importance of the processes for creating or acquiring data. The processes are the real asset.
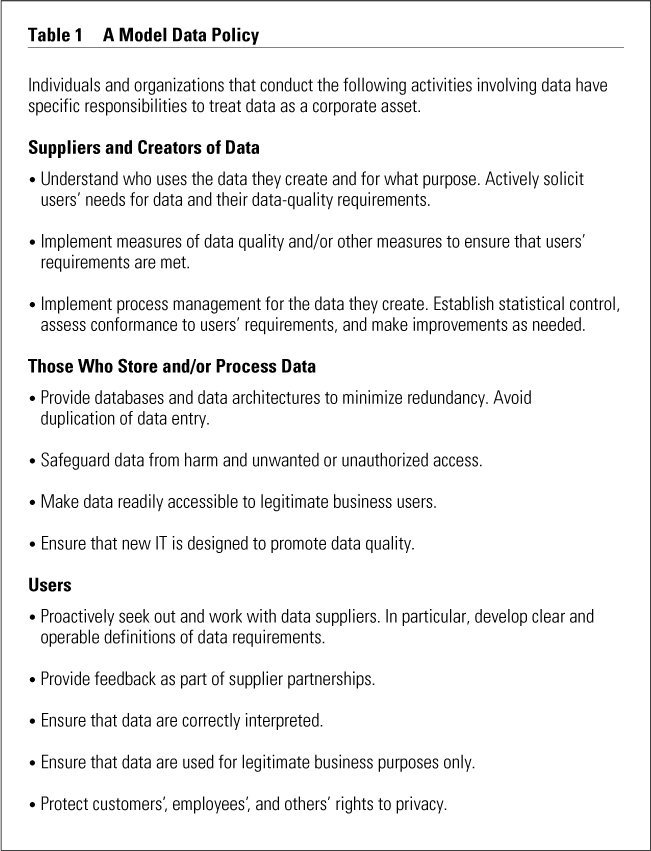
Third, align responsibilities for data quality. At the highest level, there are three principle activities involving data: acquiring them (usually by creating or purchasing), storing them, and using them.10 A data policy helps to delineate responsibilities for each activity (see Table 1).
Most organizations are both data users and data creators. For example, customer service is a user of data from order entry and a creator of data for billing. Unfortunately, most corporations (perhaps without really thinking about it) have assigned responsibility for data quality to their IT groups, which do not usually conduct all of the three activities. Often they develop data models and provide storage, but they neither obtain most data nor use them. Instead, most data come from ongoing business operations such as order entry, customer service, and billing. It is unreasonable to expect an IT group to be responsible for the quality of data that other organizations create.
Fourth, establish customer-supplier relationships for data. More and more corporations are using customer-supplier partnerships, both internally and externally, in any number of settings. These partnerships work well for data sharing as well. In our experience, starting such partnerships is not easy, but unless an organization actively manages the quality of data it receives, it cannot expect high-quality data. An important first step is to provide the supplier with clear, operable definitions of what it requires. As for the supplier, data values are usually a byproduct of a process with some other primary function, so often data quality is only a secondary concern. To counteract this, managers can direct educational programs to ensure that all individuals and groups understand the impact of poor data and are aware of their responsibilities.
Finally, invest resources to improve the quality of the asset. Frequently, eliminating redundant data yields the necessary resources to improve the most critical and poorest quality data by improving the processes that create data. In the next section, I discuss the specific methods for doing so.
Apply Quality Principles
The application of quality principles to processes that create data is a relatively recent development. The most basic idea in quality is to “create and keep a customer.”11 Toward that end, a product and/or service that satisfies customer needs better than a competing product is of higher quality. Thus the most important quality measure is customer satisfaction.
A key component of any approach to quality is to determine who the customers are and what their needs are. Then the company can produce products and services to satisfy those needs. Next I describe three basic approaches for achieving high-quality output and their application to data.
Error Detection and Correction
In this approach, a company inspects a product for conformance to requirements. In the simplest case, all products are inspected, and rejected items are discarded or reworked until they pass inspection. One strength of this approach is that it is often effective in improving outgoing quality levels. A major drawback is that inspections and rework are often difficult and expensive. Further, quality levels tend not to improve over the long term.
For improving data accuracy, the most prevalent method is to detect and correct inaccurate values. Conceptually, the simplest way is to compare data with real-world counterparts. Consider the data in an employee database on work and home locations. Administrators of such databases commonly survey employees each year to verify their information and, if necessary, make changes. Depending on the importance employees attach to the correctness of this data, such procedures can and do work well. However, they are costly and, because they do not attempt to address the causes of incorrect data, do not yield sustained improvements.
Database managers use another technique, sometimes called database bashing, which applies when data are stored in two separate databases (and the procedure is easily extended to more than two). When they compare corresponding data, they assume those that agree are correct; if they do not agree, managers investigate further and make corrections. Figure 1 illustrates one form of database bashing.
The technique has several advantages over comparing records to the real world. It is easier to manage and tends to cost less. The savings can be substantial when the databases are electronically accessible. However, like all techniques aimed at error detection, it does not yield sustained improvements.
A third technique, called data editing, involves computerized checking of data against constraints on the data. The constraints may be very simple or quite sophisticated, involving:
- A single data field. For example, “the data value must be an element of a certain domain, such as {0, 1, 2, . . . , 10}.”
- More than one field. For example, “a person may not be listed as a parent in more records than the number specified in the ‘number of children’ field.”
- Probability. For example, “the combination ‘sex = female, height = 78 inches’ is judged unlikely.” Once an error is identified, the offending fields are corrected.
The principle reason that these methods are ineffective is that they are conducted downstream from the creation of data values, either at storage or usage, so improvements are not sustained.
Process Management
Rather than attempting to identify and correct defective items, the goal in process management is to discover and eliminate the root causes of defects. The steps in this approach are:
- Establish process management responsibilities.
- Define the process and identify customer requirements.
- Define and establish measures.
- Establish statistical control; assess conformance to customer requirements.
- Investigate the process to identify improvement opportunities.
- Rank improvement opportunities and set objectives.
- Improve process quality; repeat steps as appropriate.12
In applying process management to data, the focus is on the processes that create data values. One simple method uses the results of data editing more proactively than simply correcting errors. Simple plots of the numbers of failed edits, including control and Pareto charts, provide ways to identify the causes of errors. While a failed edit usually indicates an error, there are many errors that edits cannot detect. This problem is overcome by data tracking, developed at AT&T Bell Laboratories and used at several telecommunications companies.13 Control charts help the process manager establish statistical control, assess conformance to requirements, and identify ways to improve.
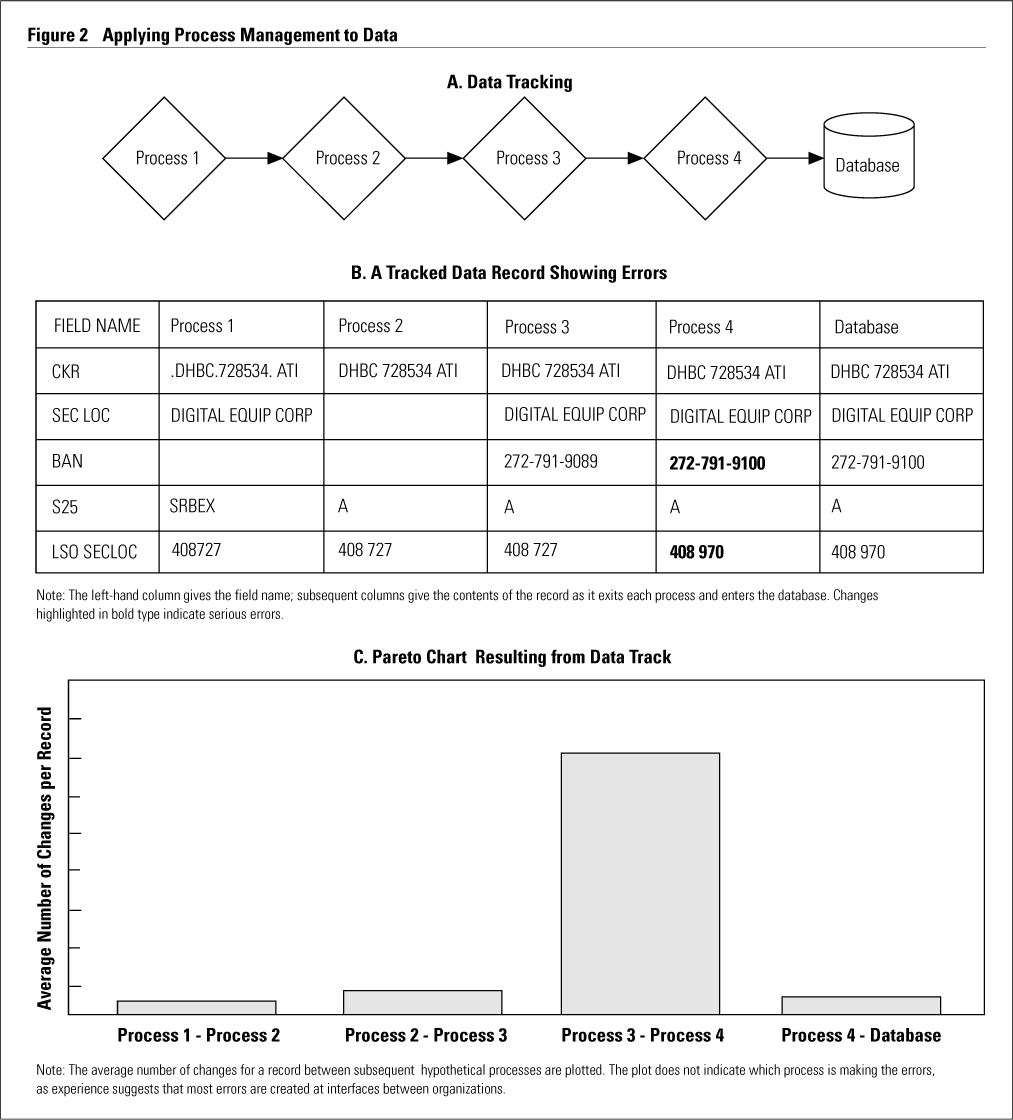
Part A in Figure 2 gives an example of a four-stage process. On an appropriate statistical basis, data tracking samples data records as they enter the process. It then tracks the records, saving their contents at each stage of the process. The next step is to examine tracked records for indications of error. Part B in Figure 2 shows a tracked record, with two serious errors in bold type. Next, statistical analyses and graphical summaries identify the most common errors. Part C shows the Pareto chart that results. In this case, most errors occur between steps three and four. Our experience has been that poor organizational interfaces (both within and between companies) are often at the root of data-quality issues, as in the case here.
Process Design
Process design focuses on making processes less error-prone. Improved designs are often effected through the incorporation of IT. As quality systems mature, they rely less on inspection/rework, more on process control, and, finally, on process design. The more advanced methods are less expensive over the long term and yield higher quality levels, though they may require initial investment.
Processes should be designed to minimize the creation of errors. For example, an automatic bar-code reader is better than a human being at reading a product code (though bar-code readers are far from perfect). Thus a process designed to promote data quality by incorporating the bar-code reader instead of a human operator is employing an improved design.
Unfortunately, there has been little research in designing processes to promote data quality. One idea is to use IT to minimize activities that people do not do well such as transcription, format changes, data entry, and so forth. Another idea is to design data-quality measurement into new processes. Thus data tracking is incorporated from the beginning.
Evolving Quality Systems
In many cases, it is appropriate to combine the approaches. To illustrate, suppose a company has discovered that the data contained in a critical database are woefully inadequate. It can adopt one of two approaches: (1) implement a massive cleanup effort; or (2) implement the three strategies (it has already achieved the first, so it needs to implement only the other two). The costs and benefits of each approach are summarized in Table 2.
Most corporations, perhaps unconsciously, choose the cleanup approach, with the predictable result that they realize only a short-term gain. Bad data soon drives out the good, another cleanup will be needed, and the corporation is caught in a vicious cycle.
A natural consideration is to combine the two approaches and obtain the benefits of both. One course is to first clean up the existing data and then implement process management to gain the immediate benefit of clean data. The danger is that the company will have other priorities and accomplish only the cleanup.
I recommend that corporations first implement the strategies, then conduct a cleanup if it is still needed. The obvious benefit is long-term improvement, so that later cleanups will not be required. In addition, the cleanup can be more carefully targeted, reducing the cost of a very expensive activity.
Implementing the Strategies
Managers need to be alert for the symptoms of poor quality data. Treating data as an asset and implementing more advanced quality methods requires an initial investment, mostly in developing a focus on data and learning to follow the three strategies. Although a perfect data-creating process does not eliminate bad data from a database immediately, relatively small investments can produce large, sustainable returns.
We applied the strategies presented here to the process shown in Figure 1 and reengineered bill verification. The bill-verification process was developed in the tumultuous days following the divestiture of the Bell Operating Companies from AT&T and was intended to protect AT&T’s financial interests.
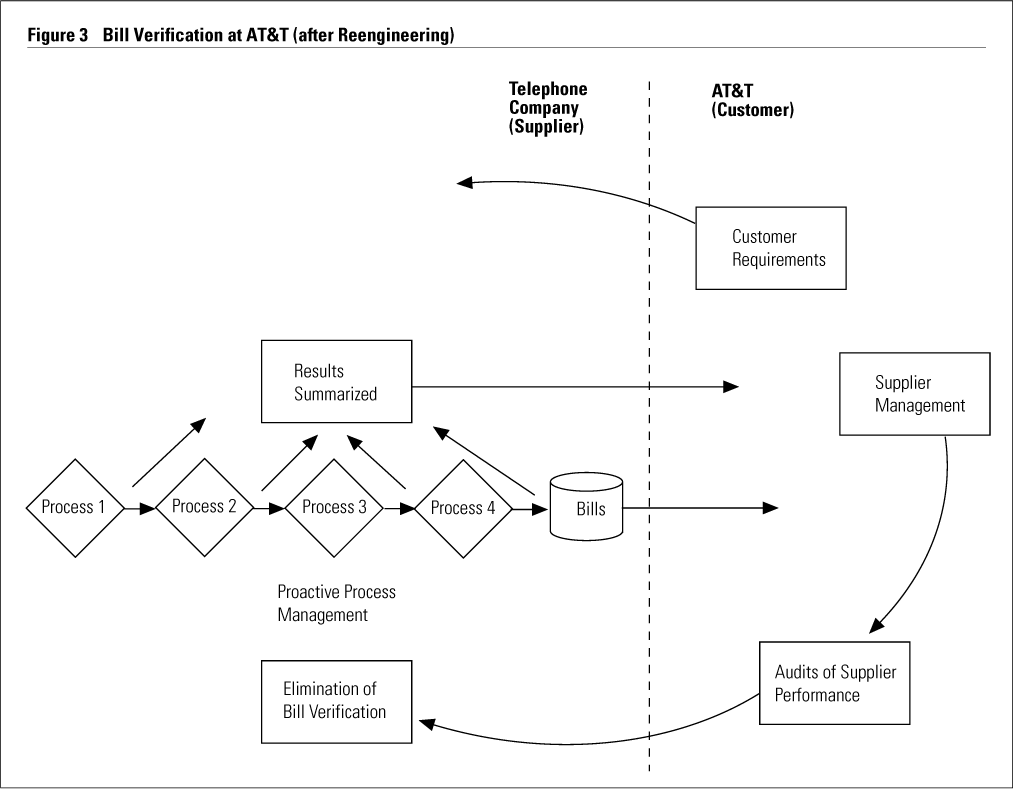
We proceeded with caution. First, we invented data tracking and applied it to an internal process. When it became evident that data quality could be markedly improved, we considered various ways to use data tracking. We tried a prototype of it in one operating company, where it yielded good results. We then developed an overall design for reengineering the bill-verification process. The new process, called “financial assurance,” is illustrated in Figure 3. It features:
- Customer-supplier relationships. A key step for the customer, AT&T, is specifying exactly what it wants to the supplier. Like most businesses, telephony is enormously complicated, and even the simple statement “we want a timely and accurate bill” can be interpreted in any number of ways.
- Proactive process management. Suppliers use data tracking and other techniques to manage and improve the bill-creating processes.
- Formal communication of results. The supplier regularly reports results to AT&T; together they set performance targets, review results, and identify opportunities for improvement.
- Periodic audits of supplier performance.
- Elimination, when high quality is achieved, of bill verification. All suppliers have improved bill quality by a factor of at least ten; many have eliminated almost all billing errors.
Both companies benefit from reengineering. AT&T expenses are cut by two-thirds, bills have fewer errors, and there are virtually no claims for rebates. Thus the telephone company eliminates the expenses associated with claims processing and rebates. Most important, working relationships improve dramatically and the level of trust is much higher.
A database is like a lake. To ensure a clean lake, one must first eliminate the sources of pollution. Too many databases/ lakes are horribly polluted. Just as those who drink from a lake are wise to treat the streams that feed it as an asset, those who use data are wise to recognize data-quality problems, to treat processes that create data as an asset, and to apply quality systems to those processes.
References
1. The only similar program we are aware of is the Total Data Quality Management Program at the MIT Sloan School, under the direction of Stuart Madnick and Richard Wang.
2. T.C. Redman, Data Quality: Management and Technology (New York: Bantam Books, 1992).
3. G. Kolata, “New Frontier in Research: Mining Patterns from Data,” New York Times, 9 August 1994, pp. A19–21; and
W.M. Bulkeley, “Databases Are Plagued by a Reign of Error,” Wall Street Journal, 26 May 1992, p. B6.
4. B. Knight, “The Data Pollution Problem,” Computerworld, 28 September 1992; and
L. Wilson, “The Devil in Your Data,” InformationWeek, 31 August 1992, pp. 48–54.
5. G.E. Liepens, “Sound Data Are a Sound Investment,” Quality Progress, September 1989, pp. 61–64;
G.E. Liepens and V.R.R. Uppuluri, eds., Data Quality Control: Theory and Pragmatics (New York: Marcel Dekker, 1990); and
M.I. Svanks, “Integrity Analysis,” Information and Software Technology 30 (1988): 595–605.
6. D.P. Ballou and G.K. Tayi, “Methodology for Allocating Resources for Data Quality Enhancement,” Communications of the ACM 32 (1989): 320–329;
J.R. Johnson, R.A. Leitch, and J. Neter, “Characteristics of Errors in Accounts Receivables and Inventory Audits,” Accounting Review 56 (1981): 270–293;
K.C. Laudon, “Data Quality and Due Process in Large Interorganizational Record Systems,” Communications of the ACM 29 (1986): 4–18;
R.C. Morey, “Estimating and Improving the Quality of Information in a MIS,” Communications of the ACM 25 (1982): 337–342;
E.T. O’Neill and D. Vizine-Goetz, “Quality Control in On-line Databases,” in M.E. Williams, ed., Annual Review of Information, Science, and Technology 23 (1988): 125–156;
G.E. Liepens, R.S. Garfinkel, and A.S. Kunnathur, “Error Localization for Erroneous Data: A Survey,” TIMS/Studies in Management Science 19 (1982): 205–219;
K.J. Sy and A. Robbin, “Federal Statistical Policies and Programs: How Good Are the Numbers?” in M.E. Williams, ed., Annual Review of Information Science and Technology 25 (1990): 3–54; and
R. Barstow, “Centel Bashes Database Errors,” Telephony, 28 January 1991, pp. 36–39.
7. C.J. Fox, A.V. Levitin, and T.C. Redman, “The Notion of Data and Its Quality Dimensions,” Information Processing and Management 30 (1994): 9–19; and
R.Y. Wang, D.M. Strong, and L.M. Guarascio, “Data Consumers’ Perspectives on Data Quality” (Cambridge, Massachusetts: MIT Sloan School of Management, TDQM Working Paper 94-01, May 1994).
8. Access services, provided by local telephone companies connect end users to Interexchange Carriers.
9. M. Light, “Data Pollution Can Choke Business Process Reengineering,” Inside Gartner Group This Week, 23 April 1993, pp. 5–6.
10. A.V. Levitin and T.C. Redman, “A Model of Data (Life) Cycles with Applications to Quality,” Information and Software Technology 35 (1993): 217–224.
11. T. Levitt, The Marketing Imagination (New York: Free Press, 1986);
W.E. Deming, “Out of the Crisis” (Cambridge, Massachusetts: MIT Center for Advanced Engineering Study, 1986);
A.V. Feigenbaum, Total Quality Control (New York: McGraw-Hill, 1983);
K. Ishikawa, Introduction to Quality Control (Tokyo: 3A Corporation, 1990);
J.M. Juran, Managerial Breakthrough (New York: McGraw-Hill, 1964); W.A. Shewhart, Statistical Method from the Viewpoint of Quality Control (Washington, D.C.: Graduate School of the Department of Agriculture, 1939); and
H.M. Wadsworth, K.S. Stephens, and A.B. Godfrey, Modern Methods for Quality Control and Improvement (New York: Wiley, 1986).
12. Process Quality Management & Improvement Guidelines, 1.1 (Indianapolis: AT&T Customer Information Center, 1988).
13. Improving Data Accuracy: The Data Tracking Technique (Indianapolis: AT&T Customer Information Center, 1992).