The Microeconomics of Customer Relationships
Using net promoter score, a metric that, in most industries, correlates well with a company’s growth rate, managers can evaluate how investments aimed at improving the customer experience actually affect the bottom line.
Topics
Jeffrey R. Immelt, chairman and CEO of General Electric Company, recently announced the extraordinary goal of boosting GE’s organic growth rate from 5% a year to 8% — a 60% increase for a company that is already the ninth largest (by revenue) in the world. As part of the strategy for reaching this ambitious target, Immelt has encouraged many of GE’s divisions to apply a simple customer-relationship metric known as “net-promoter score.”1 The ideas behind NPS, which have been around for a couple of years,2 are simple. A company asks its customers just one question — “How likely is it that you would recommend us to a friend or colleague?” — and then scores the results on a zero-to-10 scale with 10 representing “extremely likely” and zero representing “not at all likely.” Customer responses tend to cluster in three groups, each of which is associated with a set of behaviors. One group is made up of customers who give the company a nine or 10 rating. They are known as “promoters” because they behave almost as if they were adjuncts to the organization’s sales force. They report by far the highest repurchase rates, account for more than 80% of referrals and are the source of most of a company’s positive word-of-mouth. A second segment rates the company seven or eight and might be dubbed the “passively satisfied” or passives. Their repurchase and referral rates are considerably lower than those of promoters, often by 50% or more. Finally, those who give a company ratings from zero to six are known as “detractors.” Detractors are the least likely to repurchase or refer, and they account for more than 80% of negative word-of-mouth. A company’s NPS is simply the percentage of promoters minus the percentage of detractors, a metric that turns out to correlate well with increases in a company’s growth rate.
New studies show that NPS is correlated with growth rates in most competitive industry. Researchers from Bain & Company have found that, on average, a 12-point increase in NPS corresponds to a doubling of a company’s growth rate, though the variation from one industry to another is substantial. More recently, a careful study of four U.K. industries by researchers associated with the London School of Economics and The Listening Company found that a seven-point increase in NPS correlated on average with a one percentage point increase in growth rate.3 To be sure, whether the correlations imply causality is still open to debate, but the logical connection is strong4 and it raises interesting and hitherto unexplored questions. Why is the connection as strong as it is? How does the quality of customer relationships affect the economics of a business? Can the microeconomics of NPS itself ultimately be quantified and managed? How does a company raise its NPS — and on which customers should it focus its efforts? This article examines these questions. See sidebar.
Unraveling the Mystery
The key to answering many of these questions is to quantify the value of a promoter or a detractor. This is no idle exercise; it is the best way of understanding in numerical terms why and how customer relationships matter to a company’s financial performance. Most organizations are able to produce the data required, but even if your company doesn’t have exact figures, you can still learn much by using reasonable estimates.
The first step is to calculate the lifetime value of an average customer. The fundamental task is to tally up all the cash flows that will be generated over the life of a typical customer relationship and then to convert this total into current dollars, using a reasonable discount rate. The next step is to go beyond this well-worn calculation and to understand that the lifetime value of an average customer by itself isn’t very useful. In fact, promoters and detractors exhibit dramatically different behaviors and produce dramatically different economic results. The following list describes several factors that distinguish promoters and detractors, and offers tips for estimating their economic effects on a business. (See “The Value of Promoters and Detractors.”)
The Value Of Promoters And Detractors
 View Exhibit
The Value of Promoters and Detractors
Calculation and interpretation of net-promoter scores allows companies to identify the customers who help their business and those who harm it. By quantifying the value of promoters or detractors in comparison with average customers, managers can more effectively evaluate investments aimed at improving the customer experience.
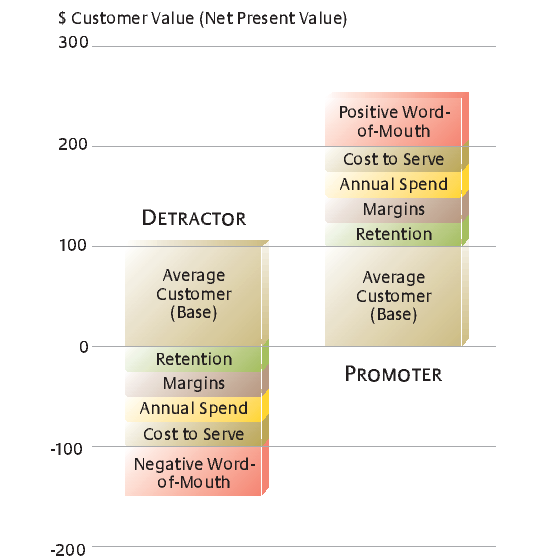
Retention rate.
The lifetime value of a customer is obviously dependent on how long the customer stays with a company. That, in turn, depends on how likely it is that the customer will defect to the competition. Detractors generally defect at higher rates than promoters, which means that they have shorter and less profitable relationships with a company. By tagging customers as promoters or detractors on the basis of their response to the “would recommend” question, a company can determine true retention patterns over time and quantify their impact. In fact, a company can estimate the average tenure of its current population of detractors and promoters even before gathering the time-series data. All that’s required is to ask customers, on the same survey with the “would recommend” question, how long they have been customers and then to use this average tenure to infer likely retention patterns.
Margins.
The lifetime value of a customer is based on the market basket of goods and services bought by the average customer. But here, too, promoters and detractors are very different. Promoters are usually less price-sensitive than other customers because they believe they are getting good value overall from the company. The opposite is true for detractors: They are more price-sensitive. A company needs to examine the market basket of goods or services purchased by promoters and detractors over a six- to 12-month period and then calculate the margin on each basket, keeping track of discounts and price concessions.
Annual spend.
Promoters increase their purchases more rapidly than detractors because they tend to consolidate more of their category purchases with their favorite supplier. A company’s share of wallet increases as promoters upgrade to higher-priced products and respond to cross-selling efforts. Promoters’ interest in new product offerings and brand extensions far exceeds that of detractors or passives. A company can gather annual spending data for a sample of customers in each category then adjust the lifetime-value calculations accordingly.
Cost efficiencies.
Detractors complain more frequently, thereby consuming customer-service resources. Some companies also find that credit losses are higher for detractors. (Perhaps that is how detractors exact revenge.) Customer-acquisition costs are lower for promoters due to both the longer duration of their relationships and their role in generating referrals. Companies can calculate or estimate all of these costs then assign them appropriately to promoters or detractors.
Word-of-mouth.
This component of customer relationships merits detailed consideration both because it is so important and because it seems to be the one that stumps most analysts. Word-of-mouth has always been important to companies; it used to be said that a happy customer tells a friend while an unhappy customer tells 10 friends. Today, customers can post their experiences on the Internet; happy or unhappy, they all have a global public-address system at their disposal. Companies are thus more dependent than ever on cultivating positive word-of-mouth and on nipping negative word-of-mouth in the bud.
Word-of-mouth, too, is subject to numerical calculation. A company can begin by quantifying — by survey if necessary — the proportion of new customers who selected their organization because of reputation or referral. Since promoters account for 80% to 90% of positive referrals, most of the lifetime value of these new customers (including any savings in sales or marketing expense) should be allocated to promoters. It’s worth noting that referred customers usually have superior economics themselves; they also have a higher propensity to become promoters, which accelerates the positive spiral of referrals.
Detractors, meanwhile, are responsible for 80% to 90% of a company’s negative word-of-mouth, and the cost of this drag on growth should be allocated to them. Perhaps the easiest way to estimate the cost is to determine how many positive comments are neutralized by one negative comment and how many potential referrals have therefore been lost. This number can be accurately determined only through customer interviews, but for an initial estimate it’s safe to assume that each negative comment neutralizes from three to 10 positives. For example, consider the process you might go through in searching for a dentist when you move to a new town. If you hear one negative comment about a particular dentist from a trusted friend or colleague, how many positive comments will you need to hear before you select that dentist?
Though all this calculation may sound complex, it doesn’t need to be. Using only publicly available data, for example, a small team in 2003 calculated the value of promoters and detractors to Dell Inc., which has the highest NPS in the Wintel personal-computer business. Securities analysts estimated at the time that each of Dell’s 8 million consumer customers was worth $210 to the company. Surveying a sample of these customers, the team was able to use the responses to quantify the factors mentioned above and allocate them accordingly. The 60% of Dell’s customers who were promoters, the researchers calculated, were worth $118 more than the average, or $328. The 15% who were detractors were worth $267 less than the average, or –$57 apiece, meaning that each one actually destroyed that much value. The difference between promoters and detractors was an astonishing $385.
The Customer Grid
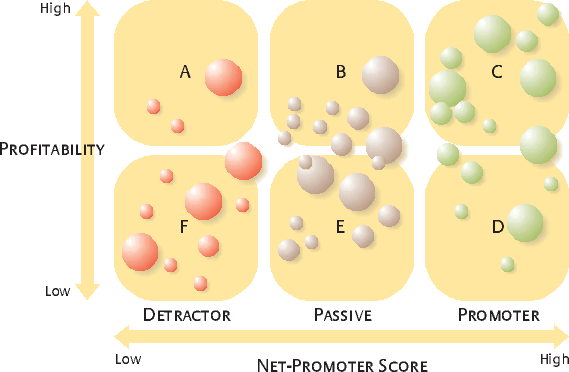
View ExhibitThe Customer Grid
Circles on the grid represent the approximate size of various customers (or segments), helping to clarify which customers are the most profitable to focus on and what strategies are most appropriate for each segment.
Converting just half of those detractors into average customers — not an unrealistic target, given that other companies with high NPS typically generate only 3% to 8% detractors — would add more than $160 million annually to Dell’s bottom line (600,000 detractors at $267 improvement per conversion). Converting some of the detractors into promoters would add even more. This simple math could help Dell managers place the right level of priority on reducing detractors and increasing promoters. Using this data, Dell, or any other company, can evaluate major investments aimed at improving the customer experience because these proposals can be subjected to the same rigorous economic analysis already applied to other investments.
Increasing NPS Strategically
The precise economics of increasing NPS — whether, for example, it is more cost-effective to try converting detractors to passives or passives to promoters — will vary from one company to another, which is why actually doing the calculations for your own customers is critically important. But a useful way of figuring out strategic priorities is to map your customer base on the promoter-passive-detractor scale and then to divide each category into high-profit and low-profit customers. (Your cost of capital is a good dividing line between high profit and low profit.) The result will be a grid in which circles represent the approximate size of the various customers (or customer segments). (See “The Customer Grid.”)
Sometimes just looking at this grid can spark targeted action. When a division of GE analyzed its accounts on the grid, managers quickly developed specific strategies for each sector. Customers in the top left, for example, were profitable but angry — and the division promptly dispatched a cross-functional team to visit each one, to probe for the causes of their dissatisfaction and to develop solutions. A consumer-oriented company can’t visit each customer, but it might ask every member of its senior team to contact a sample of these customers to find out why they’re so upset.
In general, though, you should use the grid strategically. It can help you determine which customer segments to focus on, where to allocate resources and how to design appropriate propositions for each. The grid can also allow you to visualize and manage what may be the quintessential business process: creating more profitable-promoter customers. There are three broad priorities for moving more customers into this category.
Invest in your core.
Take a good look at those customers in the upper right of the grid. They love doing business with you. They generate high margins. By definition, these people or businesses constitute your company’s core clientele. They may be even more profitable than you think they are: Remember how much additional benefit promoters bring you through referrals and positive word-of-mouth. These are the customers that should drive your strategic priorities.
But how do most companies treat these customers? At best, companies take this sector for granted. At worst, they milk it to fund solutions for other customers —those who are less happy or less profitable. Systematic underinvestment in the profitable-promoter sector explains why so many companies experience “core meltdowns” and compromise their growth. Think back to American Express in the 1980s, for example. The company took the healthy profits it was earning from its core travel-card business and financed an expansion into a broad array of financial services. Even within the card division, margins from high-volume customers went toward the acquisition of new customers rather than toward enhancing the experience of those core customers. For instance, the company’s rewards programs — miles or other benefits earned by charging on the American Express card — were narrow and over-cautious; their purpose was primarily to limit defections to competitors’ cards. The result of all these moves wasn’t hard to predict. Visa and MasterCard issuers ate into American Express’s share of wallet for its most profitable customers. American Express’s growth and profits tailed off accordingly.
Over time, however, American Express learned how to design compelling value propositions for its core customers. It transformed its earlier Membership Miles program into Membership Rewards, one of the most generous awards programs in the industry. Rather than offering the program only to card members who signed up for it and paid a fee, as before, the company launched products that included the program as a core benefit. American Express created partnership programs with travel-related companies such as Delta Air Lines and Starwood Hotels, so that frequent travelers could earn bonus points; it also created a partnership with Costco, designed to appeal both to consumers and to the small-business owners who are among Costco’s prime customers. A special card called Rewards Plus Gold — offered primarily as an upgrade to high-value core customers — gave card members additional points and free extra cards and turned out to be immensely popular. Thanks largely to word-of-mouth, the Rewards Plus Gold card soon grew to significant size and became one of the most profitable products in American Express’s portfolio.
Address the detractors.
If upper-right customers are your top long-term priority, the upper left should be next. In fact, sometimes the actions required here may be quite urgent. Customers in this sector don’t like doing business with you and are spreading negative word-of-mouth. They may defect at the first opportunity. Yet because they are profitable, you can afford to invest in solving their problems, hopefully even converting them into promoters.
Sometimes all you have to do is talk to them, identify their concerns and solve their problems on the spot with a rebate or an apology. More often, these customers are offended by company policies that need to be changed. For example, a mobile-phone provider found that many accounts in this sector of its grid had accepted long-term contracts at fixed prices. Now these prices were not competitive, yet the customers were locked in — and they were furious. But this was a problem that could be easily fixed: The company simply contacted the customers before their contracts expired and offered far more favorable terms on a renewal. The fix cost money to be sure. But holding customers hostage to deals they resent, with all the resulting negative word-of-mouth, undoubtedly would have been more costly in the long run.
The customers in the lower left — detractors who do not generate much profit — may be a slightly lower priority but only slightly. For one thing, most companies will find that they have many accounts in this sector. For another, whatever profits are generated in this sector are too low; they are actually destroying shareholder value. Indeed, given the negative economics of detractors, whatever profits you think you are earning are probably greatly overstated. These customers are hammering your reputation and turning off other prospects by voicing their grievances. They are taking out their frustrations on your frontline employees. They are filing a disproportionate number of complaints and lawsuits.
The rule for these customers must be: up or out. Since there is little profit to invest in fixing their problems, you must either discover a more efficient way to serve them or find a way to move them to the competition. Sometimes, of course, they were merely sold the wrong product or service initially, and all that’s necessary is to get them into the right package. And sometimes you can figure out lower-cost processes for serving them, just as banks have converted unprofitable branch customers into profitable ATM and online customers. Otherwise there is little to do except guide them to an alternative supplier.
Find additional promoters.
How can you economically increase the population of customers in the upper-right sector? The two choices are to move the promoters in the lower right up by increasing their profitability or to move the passives from the upper middle (who are already profitable) over into the promoter category.
Take the move-the-promoters-up option first. It’s tempting to raise prices for these customers, thus immediately boosting their profitability, and in some cases that may be the right tactic. But beware! These referral-generating, positive-word-of-mouth–giving, faithful customers are probably far more valuable to you than profit calculations alone can show. You don’t want to milk their good will. Since they already love you, it might be better to find opportunities to cross-sell goods or services, or look for other ways to encourage them to give you more business. This is essentially what Amazon.com has done with its personal recommendations and incentives such as premium shipping.
Of course, these customers may not be good candidates for change, given their age or income levels. In that case you must look for investment opportunities that can move passive customers from the upper middle (and maybe even the lower middle) into profitable-promoter status. There’s no shortcut here. You’ll have to learn why these customers aren’t enthusiastic about your company. You’ll have to figure out what would truly delight them, and whether the required investments would make economic sense. And if you decide to make those investments, you’ll have to track customer migration on the grid to determine whether they are really paying off. Otherwise you will simply be stealing resources that could be invested in your core customers whose referrals will almost always represent the best source of new promoters.
Again, American Express offers examples of both of these strategies. The company has found, for instance, that many loyal users of one level of card are prime candidates for an upgrade — that is, moving from the green card to gold, from gold to platinum, and from platinum to the premium card known as the Centurion card. American Express has found that the profitability of customers who upgrade increases as much as fourfold — even more for some customer segments. Upgrades are available even for specialized cards such as the Delta SkyMiles card, and the effects are similar. Thus the Platinum Delta SkyMiles card has a higher annual fee but provides additional benefits; it gives the card member an incentive to use the card more in order to earn these benefits.
The value of NPS, like the value of any good metric, is that it allows experimentation. A company that produces NPS data regularly and with sufficient granularity can track and assess its strategic and tactical moves month in and month out. For Gary Reiner, GE corporate chief information officer, Six Sigma leader and one of the executives CEO Immelt has tapped to guide the success of customer metrics, the versatility of NPS is rooted in its simplicity: “In a company of our size and complexity, it becomes critically important to focus on one number that is practical to measure. It is also vital that this metric reliably links to profits and growth.” See sidebar.
References (4)
1. This term has been trademarked by Satmetrix Systems Inc., and ownership of the trademark will be shared by Satmetrix, Bain & Company, and the author of this article.
2. See F.F. Reichheld, “The One Number You Need to Grow,” Harvard Business Review (December 2003).