Linking Actions to Profits in Strategic Decision Making
Between 1990 and 1993, customers of the commercial waste-collection services of Browning-Ferris Industries (BFI) defected to competitors at a rate of 11% to 13% per year. Senior managers focused on raising customer satisfaction, but between 1995 and 1997, the defection rate increased to 13% to 15%. BFI’s original growth strategy of acquiring similar businesses that would provide new customers had become too expensive. The only alternative appeared to be customer retention, so managers began exploring what effect it could have on profit. When they discovered that a mere 1% decline in customer defection would yield a pretax profit increase of $41 million, customer retention took on heightened importance. Managers learned to follow a chain of links from poor customer satisfaction back to a specific problem action and then invest in correcting it.
The result was dramatic. Falling customer-satisfaction scores leveled off and then began to climb rapidly. Customer-defection rates dropped to below 10%. BFI was able to sustain profitability in the face of losses from its other business operations. Managers learned about the links from the customer-service-dependability rating to overall customer satisfaction to the customer-defection rate. They could see which specific actions would have the best payoff, and they invested in those.
BFI is one of a growing number of companies that are moving beyond a vague desire for “shareholder value” and “customer focus” and asking the questions that can get them there. How does a company identify and measure causal relationships between parts of its organization? What really drives profit and creates value? How does an operating or capital-investment decision affect profit?
That type of probing goes beyond individual departmental goals to a cross-functional view of the company’s objectives and relationships. Human-resource departments strive to improve employee satisfaction. Marketing departments focus on achieving higher levels of customer satisfaction and loyalty. Operations functions attempt to raise product quality. Those goals differ, but each department ultimately shares a larger goal: Make the company more profitable.
Companies may have success meeting departmental goals, but they often stop analyzing cause and effect once the goal is met. Later they wonder why a string of individual successes hasn’t led to an increase in corporate profit or shareholder value. They don’t see that because their analysis fails to bridge functions and actions, they can’t hope to reap the highest corporate profit.
When forced by competition and the failure of other alternatives, some companies have attempted to make the cross-functional link between their actions and profit, but their approach is usually piecemeal. Lacking a general framework to start with, they waste time and money establishing links through trial and error.
A way to eliminate some of the uncertainty in defining links can be found in the action-profit linkage (APL) model, which lets managers see just how any action within any corporate function affects overall profitability.1 Managers can identify and measure key drivers of business success and profit, develop causal links among them and estimate the impact of actions taken to bring them about. They can narrow their strategies to the areas with the highest payoff. Thus attention shifts from a preoccupation with individual performance metrics to an awareness of how those metrics work as a system and how they can increase profit and shareholder value.
Where the Payoff Comes From
At certain points in their history, companies that have linked actions to profit have had dramatic results: Sears, Roebuck and Co., for example, was able to see that a 5.0-point improvement in employee attitudes would drive a 1.3-point improvement in customer satisfaction, which would drive a 0.5% improvement in revenue growth. Sears went from a loss of nearly $4 billion in 1992 to a profit of $1.5 billion five years later.2 Although there are many possible explanations for that turnaround, Sears managers believed it was largely due to a culture change; an abbreviated APL model played a role in that change.
Managers at the Canadian Imperial Bank of Commerce (CIBC) and BFI also saw the payoff from carefully identifying, articulating and measuring the causal relationships between actions and profit.
Canadian Imperial Bank of Commerce
In 1996, CIBC, a national bank with 6 million customers and $250 billion in assets, was facing increased competition from deregulation. Its customer defection rate was approaching 10%, with another 15% of its customers estimated to be on the fence or close to defection. Seriously concerned, senior managers pondered how to reestablish the bank’s market position. A first step would be to articulate the drivers of business success.3 Hoping to learn how their own behavior was affecting customer retention, they decided to develop a model to link action to profit. (See “How Does Management Behavior Affect Customer Loyalty?”)
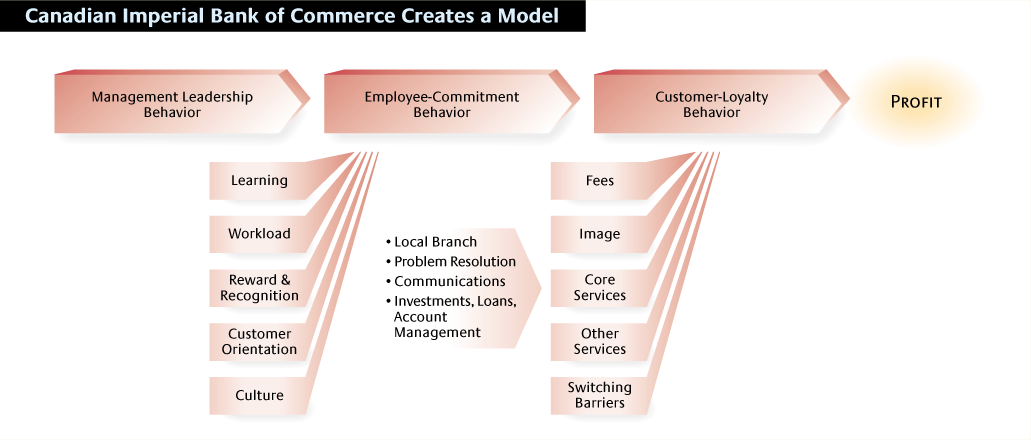
CIBC’s model asserts that profit is driven by customer behavior, which is driven by employee commitment, which is influenced by leadership from management. CIBC created parallel models for four customer groups: personal groups (consumers), small businesses, large businesses and insurance groups. The bank used surveys to gather the considerable information required for analyzing the links. It also invested in a customer-information warehouse, with more than 1,000 data attributes per customer and 25 rolling months of data.
From that information, CIBC, with the help of consultants, was able to define customer-loyalty variables. Variables included customers’ intentions — to continue using the banking services purchased, to recommend the bank to other customers, to purchase more of the bank’s services, and to use the bank’s services exclusively. CIBC then linked those loyalty variables to their drivers: what customers thought about core services, noncore services, banking fees, the bank’s image and barriers to switching banks. Finally, it elaborated each loyalty driver for its own drivers. For example, it found that core-services loyalty is linked to such factors as customers’ evaluation of the local branch and the bank’s efficiency in resolving problems.
The model helped CIBC managers identify key relationships. For example, they found that a 1-point increase in any of the loyalty-behavior elements increases profits by $0.60 per month per customer. They also found that a 5% increase in employee commitment yields a 2% increase in customer loyalty, which increases profitability by $72 million annually.
The BFI Story
In 1998, BFI (now part of Arizona-based Allied Waste) was the second-largest waste-disposal company in North America, serving both business and household customers throughout the United States, Canada, Europe, the Middle East and the Pacific Rim. It had revenues of $4.7 billion and profits of $338 million.
But BFI wasn’t always so profitable.4 From 1990 to 1993, its customer defection rate was 11% to 13% per year. The company tried rigorous contract enforcement, price reductions, customer newsletters and other relationship-marketing activities. Nothing helped. Managers developed a comprehensive customer-satisfaction management and tracking program, surveying customers in each locale quarterly and reporting results to each collection district for action. It tried incentive compensation, recognition programs and more internal communications. Still customer satisfaction declined, and customer defection increased.
But once BFI senior executives determined that cutting customer turnover by 1% would yield nearly $41 million in pretax profit, they began to focus on customer-satisfaction drivers. With the aid of a consultant, BFI developed a complete set of links between actions and profits.
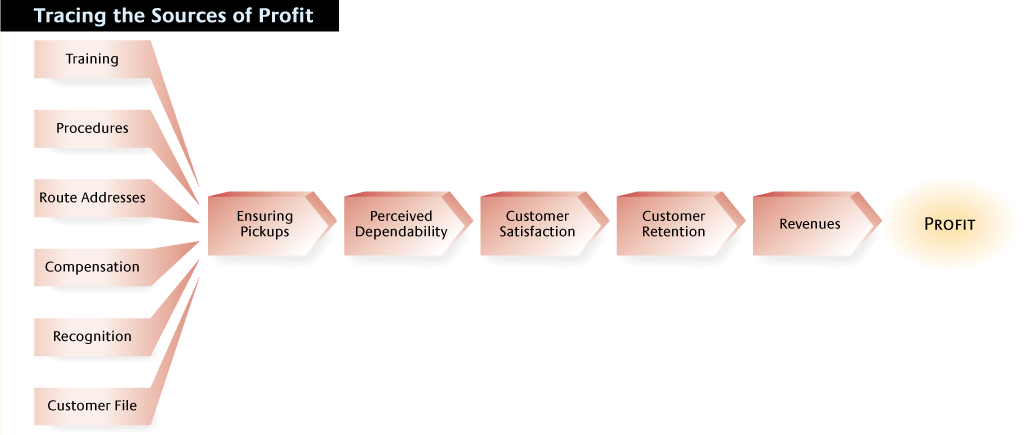
The model helped BFI managers look at the specific drivers of customer satisfaction. They were able to see that customers’ perceptions of BFI’s dependability were key. That led them to look at breaches in service and determine that missed pickups had the largest effect on how customers perceived service dependability. As BFI managers studied the causes of missed pickups, they were able to identify measures to reduce them, such as training drivers better, standardizing procedures, offering incentive compensation, improving driver communication with central dispatch and capturing customer information. They prioritized the measures and directed all 180 collection districts to implement them.
Defection dropped to less than 10%, and profits increased. BFI was able to see a path from perceived service dependability to customer satisfaction to reduced defection — to profit. A 2-point gain in service dependability led to a 1-point gain in overall customer satisfaction, which led to a 1% decline in customer defection, which produced a pretax increase in profits of $41 million. (See “How Missed Trash Pickups Affect Profits.”)
A Decision-Making Tool
To improve decision making, managers must trace how company actions affect profitability overall and across the entire enterprise. As its name implies, the action-profit linkage model helps managers investigate the relationships between action and profit. (See “The Action-Profit Linkage Model.”) It lets them make informed decisions that enable actions to achieve the highest possible profit.
Linking action and profit isn’t a new idea, but the other models are generally implemented on a limited scale or within specific functions. (See “How Other Models Compare With the APL Model.”)
The APL model has several advantages over other models. First, it focuses attention on the company’s specific actions and their effects on employees, customers and, ultimately, corporate profitability. The focus is not limited to the pursuit of intermediate goals such as customer satisfaction, loyalty or quality. That distinction is important because actions, unlike customer satisfaction and loyalty, are directly related to revenues and costs and are therefore accountable — also because the relationship between customer satisfaction and profitability is neither simple nor consistent across all companies.
Second, APL fosters an investment-based approach to managing the trade-offs in decision making because managers link their actions to overall corporate profitability, not to local consequences. Defining the links between investment choices and corporate profitability will help improve decisions made to implement strategy.
Third, companies can adapt the APL model to many business situations. Links that drive profit differ across actions, customer segments, industries and company size, and APL’s flexibility lets managers explore multiple routes to long-term profitability.
Finally, the APL model is not tied to any specific data-collection or estimation procedure. It uses an iterative process that starts with estimating links. As companies accumulate data and learning, the process becomes more data-driven and the estimates more comprehensive. Developing and testing their customized models, companies begin to limit their investments to those that improve profitability; the model’s output discourages investment in unprofitable areas.
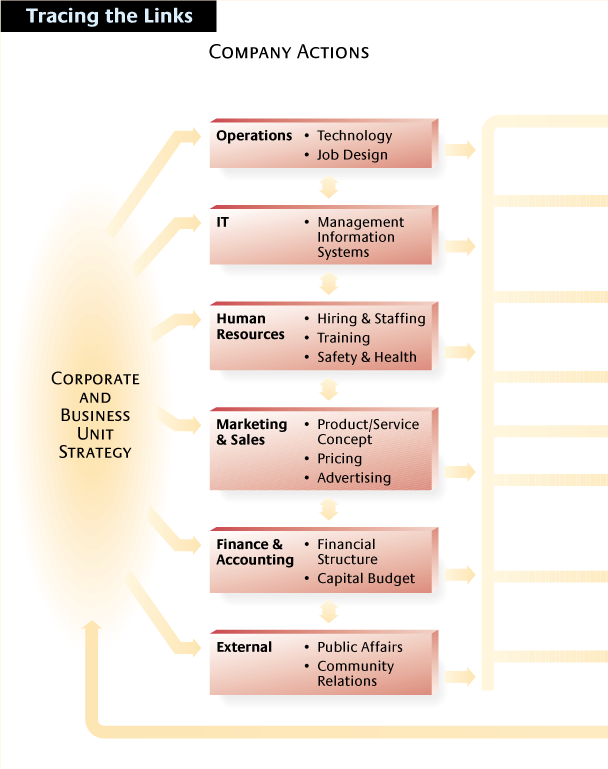
From Action to Profitability
A company using the APL model begins with corporate strategy and moves from there to component one, company actions. Once the enterprise has decided which actions it wants to explore, it can begin defining the path from the action to corporate profitability. The corporate-profitability segment of the model then feeds back into the corporate strategy. In other words, as managers articulate the links from an action to profitability, they get valuable insight into improving the business strategy.
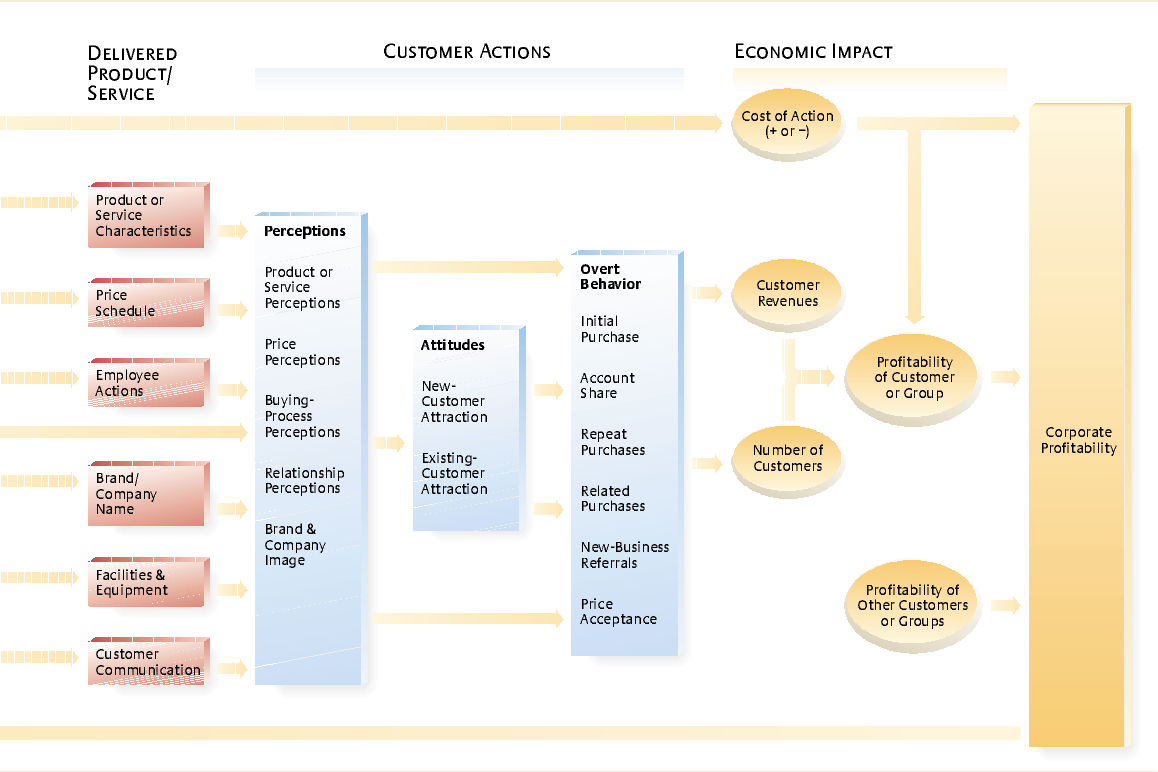
Component two is delivered product/service — everything the business makes available to customers for purchase. It comprises product attributes, brand, customer-service activities and more.
The elements of component two link to several forms of component three, customer actions. The first subgroup is perceptions — what customers think about the delivered product or service. Customer perceptions, which are based on direct experience with the product or on the company’s communications, are indispensable for linking actions to profit, since they represent the first step in the buying process.5
Perceptions can determine whether existing and new customers feel inclined to buy or rebuy the product. Thus, perceptions drive the second customer-actions subgroup, attitudes, including customer satisfaction and new-customer attraction.6 Attitudes, in turn, drive the third customer-actions subgroup, overt behavior — customers’ purchasing responses.
Major component four, economic impact, takes the cost of the company action and the revenue resulting from customers’ overt behavior — and arrives at the action’s contribution to profit. Some aspects of customers’ overt behavior (say, new-business referral) determine the number of customers the company will receive. Other aspects (say, repeat buying) determine the revenue each customer will generate per year. The number of customers times the average customer revenue will yield the total revenue all customers generate.
Companies can attribute the cost of an action either directly to individual customers (as in the case of improving the quality of airline meals) or indirectly (for example, in adding financial-planning staff). After managers deduct the cost from customer revenue, they arrive at the profitability of each customer group. The last step is to roll up all customer-group profitability results into corporate profitability.
Managers of companies with few customers do not need to establish customer groups or segments, but can do the analysis on individual customers.
Frequently, an action intended for a specific customer group can change the profitability of other groups. When Microsoft launched its Windows 2000 Professional Edition to its business customers, some of its introductory advertising also induced individuals to buy the consumer version. Both the intended effect of its business-to-business advertising, as well as its unintended effect on consumers influenced Microsoft’s total profitability. The APL model accounts for such network effects by incorporating and measuring links between products or business units.
Developing a Customized Model
The general APL model is just a starting point for exploring relationships among key performance metrics. The process of customizing the general APL model is just as valuable as the final model with defined links because it gets managers to focus on relationships. For that reason, customization should involve a wide cross section of the senior management team.
Establish Links
The first phase in customizing the APL model involves laying out the links hypothesized from reviewing the business situation. The links are based on managers’ experience and intuition. Employees and customers also may be a helpful source of hypotheses about links involving their own behavior. CIBC, for example, defined the link from its service process to customer loyalty by surveying employees.
Define Metrics and Collect Data
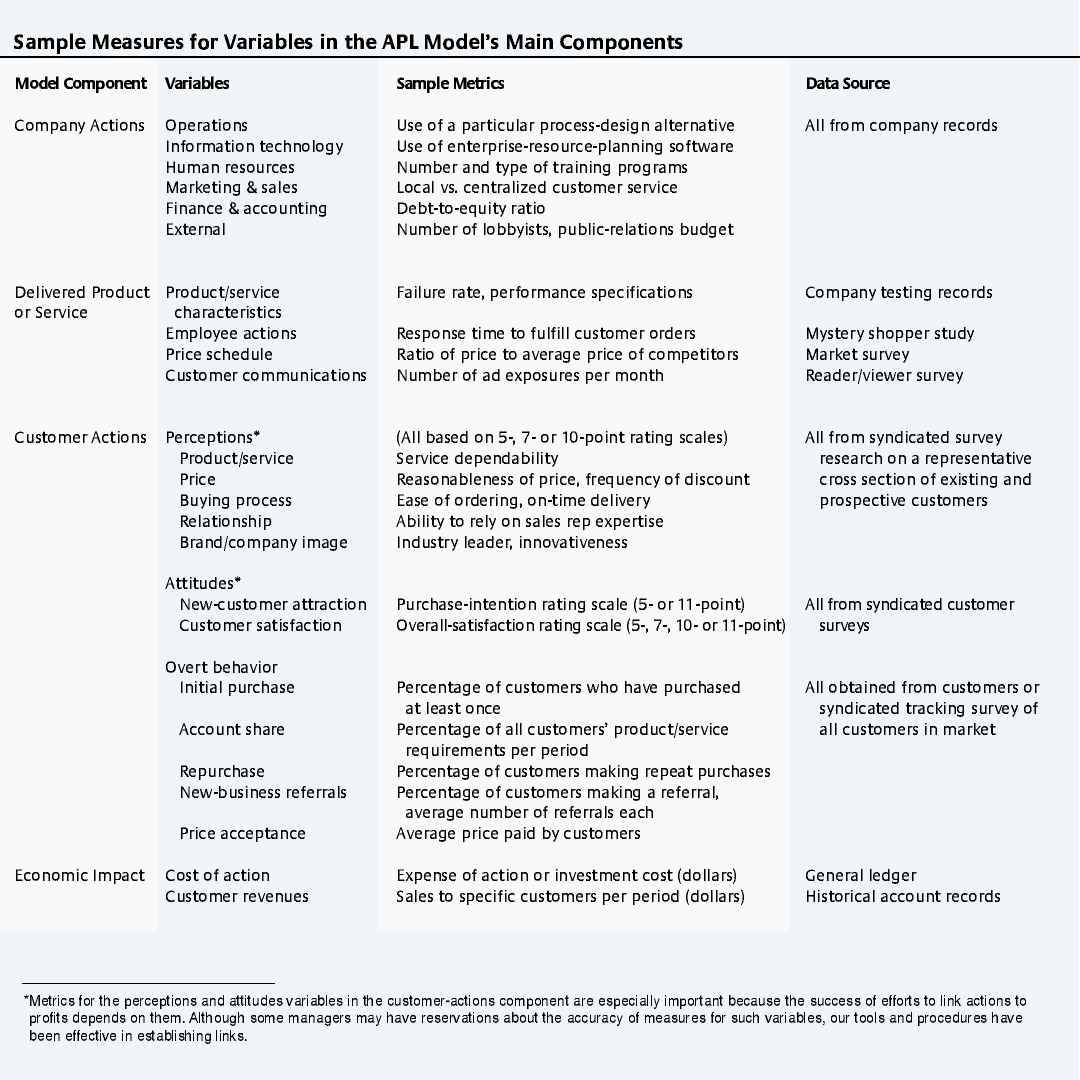
In the second phase, the company defines metrics for each variable in the model and collects data to test the validity of the customized model it has hypothesized. (See “Guidelines for Measurement and Data Collection.”)
A company will seldom have all the necessary metrics. Even businesses with abundant data in their information systems may, like CIBC, decide to make additional investments in IT or in data warehousing to compile all the information.
- To develop metrics for the model, a company can:
- extract metrics (for example, average customer revenue) from its information system;
- develop metrics (for example, customer-defection rates or activity-based cost of company actions) from data in its information system;
- develop metrics (for example, sales-call frequency) from data to be captured by its information system;
- purchase metrics (for example, the buying patterns of prospective customers or objective service-quality indicators) from research companies, syndicated data sources, and the like; or
- generate metrics (for example, customer-satisfaction and perceptions measures) from its own or commissioned surveys.
There is also the question of the appropriate unit of analysis for the metrics. For example, should a bank gather customer-survey data on individual customers, branch offices, trading areas, regions or across the company as a whole? Should it gather the data once or repeatedly? For some links, such as the link from customer-perception metrics to attitude metrics, the unit of analysis should be the individual customer. For others, such as the link between the delivered product or service and customer perceptions, the unit of analysis should be the operating unit. If the company is a bank, the operating unit might be the branch office, and the metric could be a mystery-shopper study of service quality. The bank would then aggregate its individual-customer-perception ratings into an average for the branch and relate that to the service-quality metric for that branch.
Sometimes the only unit of analysis available is the company as a whole. For example, IT limitations may force a bank to measure customer defection for all its customers rather than for each branch individually. In that case, the bank would gather the measures over several succeeding time periods.
Analyze Links
In the third phase, the company assesses the strength of the links through a statistical analysis of the collected data. Multiple-regression analysis works best because it provides numerical estimates of the strength of relationships between predictor (or cause) variables and a single dependent (or effect) variable.
Assessing the proposed model’s fit is important. If the fit is poor, the company must return to the first phase to identify missing elements or variables — or to the second phase to get better metrics. If the fit is adequate, the company retains the strongest links for interpretation and application.
As the company evaluates the initial model, it will inevitably add links and drop any that lack enough evidence of a strong relationship. Phase three is critical because it is here that a final model emerges. The focus then shifts to applying the model to support decision making.
Updating the Customized Model
Companies should monitor the customized APL model for any changes in the links among metrics. External factors can change. For example, customer expectations might increase; a new competitor might emerge. Internal factors also could change — for example, if the company undergoes a reorganization. Even the passage of time may alter the relationships among model elements.
Updating requires reassessing metrics and links. Companies with a relatively unstable operating environment may have to update more often than those with stable environments, but the benefits of maintaining the model — continued insight into actions that are profitable — make the frequent adjustment worth the trouble.
To see how a model can expand, consider a hotel with this chain of links: incentive compensation to the cleaning staff → cleanliness of guest rooms → customer satisfaction → customer retention → customer revenues. Over time, the higher levels of customer satisfaction lead to better interaction between customers and customer-contact employees, which increases the number of compliments about the staff. Employee job satisfaction increases because of expressions of customer support, employee turnover is reduced, and personnel hiring and training costs go down. Thus the model gains several links, and the original action “incentive compensation to cleaning staff ” has an increased impact on profitability. That increase would be lost on managers who did not conduct such an analysis, limiting their ability to identify the actions and investments that would lead to the most profit.
Some Implementation Advice
Managers who develop and implement sound APL models will be the first to agree that measurement is difficult and evaluating causal relationships between metrics even more so. Often a company cannot develop model elements in rapid succession. For example, it cannot measure the impact of a new advertising campaign on customer perceptions without a sufficient waiting period. Not allowing for the appropriate leading or lagging indicators can nullify or distort relationships.
Sometimes metrics may interact to affect the resulting variable more severely than they do individually, which makes it harder to analyze links. Organizational changes, new products, new technologies and new sales channels — all require that a company rethink its APL model.
Such challenges to accurately estimating links do not prevent a company from building an APL model. Rather, they point to the need for the right model-development environment:
- Managers must be committed to the effort. Senior managers must consistently support the process of identifying and measuring causal relationships. They could demonstrate importance by asking about the effort in monthly operating reviews, for example.
- Approximations are better than nothing. Managers must be willing to accept approximations and predictions that point in the right direction, rather than insist on perfect estimation and wind up with no way to trace the impact of an action on profit.
- Keep it simple. The model should have an intuitive or common-sense basis so that the rest of the organization can readily understand it.
- Carefully articulate and communicate the model. Managers should communicate the model throughout management ranks and actively encourage its use to support decision making. The simpler the model, the easier that will be. The model’s introduction should be treated like any other organizational change.
- Consider a partial model. Customizing a complete APL model involves significant management time, data costs, analytical effort and internal communication. It may not be worth it, depending on how much the model improves decision making and resource allocation. A partial model, one that features only certain actions or potential actions, may be a more cost-effective approach.
- Don’t minimize the process benefit. Companies can benefit by using the model to guide their thinking about the links among their own metrics, even if they do not gather data to test the model fully.
The APL model helps managers understand how they can create superior value and competitive advantage for their company. By identifying the most useful linkages between actions and profit, the model fosters a common management focus on the variables that matter most. (See “Why Use the Action-Profit Linkage Model?”) Even more important, the model helps develop disciplined thinking about profit drivers by tracing them back through the customer, the product offering and ultimately the company’s actions. Getting the management team focused on a common thought process is among the most important things a CEO can do to improve managers’ decision making in both strategy and strategy implementation.
References
1. M.J. Epstein, P. Kumar and R.A. Westbrook, “The Drivers of Customer and Corporate Profitability: Modeling, Measuring and Managing the Causal Relationships,” Advances in Management Accounting 9 (2000): 43–72.
2. A.J. Rucci, S.P. Kirn and R.T. Quinn, “The Employee-Customer-Profit Chain at Sears,” Harvard Business Review 76 (January–February 1998): 83–97.
3. J. Tofani, “The People Connection: Changing Stakeholder Behavior To Improve Performance at CIBC” (presentation at the 12th Annual Customer Satisfaction & Quality Conference of the American Marketing Association and American Society for Quality, San Antonio, Texas, Feb. 22, 2000).
4. R.A. Westbrook, “BFI: Customer Satisfaction Program” (Houston: Rice University, 2000).
5. Our categorization reflects an elaboration of the useful taxonomy proposed by R. Kaplan and D. Norton in “The Balanced Scorecard: Translating Strategy into Action” (Boston: Harvard Business School Press, 1996).
6. Customer perceptions were first identified as the drivers of customer satisfaction in R.A. Westbrook, “Sources of Satisfaction with Retail Outlets,” Journal of Retailing 57 (fall 1981): 68–85.
ADDITIONAL RESOURCES
Much of what has been written about profitability modeling does not take a cross-functional approach. Author Marc Epstein’s “Customer Profitability Analysis,” published last year by the Society of Management Accountants of Canada, integrates material on activity-based costing, marketing considerations and performance drivers.
Epstein and Bill Birchard’s “Counting What Counts: Turning Corporate Accountability to Competitive Advantage,” published in 1999 by Perseus Books, presents a broad model that demonstrates the importance of identifying and measuring performance drivers and the causal relationships between them.
The balanced scorecard is another valuable approach that works well with the action-profit linkage model. Robert Kaplan and David Norton offer a complete balanced-scorecard discussion, including an extensive treatment of strategy maps, in “The Strategy-Focused Organization: How Balanced Scorecard Companies Thrive in the New Business Environment.”
Analyzing links is perhaps the hardest part of profitability modeling. In their 1997 Free Press book, “The Service Profit Chain,” James L. Heskett and colleagues provide many examples of how companies linked employee satisfaction, customer satisfaction and corporate profits. Anthony Rucci, Steven Kirn and Richard Quinn look at how to identify and measure links among employee behavior, customer satisfaction and profitability in a January–February 1998 Harvard Business Review article.
Customer satisfaction is at the heart of many profit relationships. Michael Johnson and Anders Gustafsson offer a comprehensive discussion in “Improving Customer Satisfaction, Loyalty, and Profit: An Integrated Measurement and Management System” (San Francisco: Jossey-Bass, 2000). And in a fall 1999 Marketing Management article, Timothy Keiningham and colleagues look at how one company used customer-satisfaction information to improve market share and profitability.