Trade, FDI, and the Dollar: Explaining the U.S. Trade Deficit
Ten years ago, Peter Drucker offered three reasons why the foundation and structure of the world economy had changed:
- The uncoupling of the primary products and the industrial economies resulting in a decline in the comparative advantages of natural resources.
- The uncoupling of employment and production within the industrial economy due largely to productivity gains associated with technology.
- The partial uncoupling of trade and economic growth, with capital flows replacing trade as the engine of the world economy.1
In the decade since, a fourth factor has been widely recognized: the uncoupling of nations and firms, with firms’ strategic decisions emerging as a critical determinant of international flows of trade and investment.2 Taken together, these factors have undermined — perhaps permanently — the integrity of traditional models of trade and investment. At the very least, they have introduced a new level of complexity into the analysis.
For example, a basic tenet of economic theory is that currency depreciation promotes exports and improves a nation’s trade balance. However, between 1970 — just before the collapse of fixed exchange rates — and early 1995, the U.S. dollar lost more than 70 percent of its value against the yen and 60 percent of its value against the mark,3 yet, in 1994, the United States had a $69 billion merchandise trade deficit with Japan and a $13 billion deficit with Germany.4 In total, the U.S. trade deficit reached a record $170 billion in 1994 despite the dollar’s sporadic decline during the previous two decades. This article attempts to explain these anomalies.
Since currencies began to float more or less freely in 1973, the link between exchange rates and trade flows has become increasingly tenuous. One reason has been the rapid increase in international capital flows. Because capital flows are far more sensitive than trade flows to minor changes in exchange rates — particularly in the short run — countries that attempt to boost exports by weakening their currencies may experience a host of undesirable side effects, including large inflows of foreign direct investment, large outflows of foreign portfolio investment and domestic “flight capital,” and higher domestic interest rates. A second factor has been the growing importance of multinational corporations in dictating international trade patterns. By establishing global production and distribution networks, these firms act to replace exports from their home countries with local production in foreign markets. The growth of international capital flows and the popularity of “global” strategies have radically altered the logic of international trade and, as a result, undermined the traditional impact of exchange rates on national and international trade flows.
In contrast to traditional, macroeconomic explanations for the U.S. trade deficit — such as the overvaluation of the dollar in the early 1980s, the unwieldy U.S. budget deficit, or the gap between domestic saving and investment — I examine two alternative rationales: America’s declining manufacturing base and the concurrent shift of the U.S. economy toward services. The effect of the declining manufacturing base is twofold. First, it has increased America’s dependence on foreign imports of many industrial and consumer products, and, second, it has decreased America’s ability to export. By aggressively moving production to offshore locations, many U.S. companies have contributed to this process. The shift to a service economy has also reduced America’s export potential. Although international trade in service has grown rapidly in recent years, it remains only a fraction of merchandise trade. Consequently, despite recent surpluses in traded services, the United States’ growing demand for foreign manufactured goods has produced large trade and current account deficits.
Taken together, these factors suggest that the U.S. trade deficit is structural in nature, and, as a result, traditional macroeconomic solutions — such as the depreciation of the dollar — in and of themselves will have only a minor effect. In fact, by increasing the price of foreign imports, the dollar’s further decline may initially exacerbate the trade deficit along the “J-curve.” In the long run, correcting the trade imbalance will require a substantial commitment to expanding America’s manufacturing base, which in turn will require a consistent set of long-term policies designed to encourage firms to increase their manufacturing activities in the United States. It is important to note, however, that foreign investment in the United States is not a substitute for U.S. investment because many foreign firms use their U.S. affiliates to distribute products made elsewhere.
The next section provides an overview of the United States’ relative trade performance since 1970, followed by a more detailed analysis of the U.S. trade deficit and its causes. Subsequent sections examine the link between trade and foreign direct investment (FDI), explore the impact of the dollar on U.S. trade and FDI, and, finally, discuss policy implications. Although many of the arguments are well known, when viewed in concert, they provide a compelling explanation for the U.S. trade imbalance and the general ineffectiveness of traditional macroeconomic solutions. They also support Drucker’s contention that the structure of the world economy has changed and suggest that we need to reevaluate a number of long-standing assumptions about international trade and investment.
Assessing the United States’ Trade Performance
Since the early 1970s, the United States has experienced an erratic but persistent and generally expanding deficit in merchandise trade. I argue that U.S. trade woes are the consequence of three distinct yet closely related factors: (1) the structural shift of the U.S. economy from manufacturing into services, (2) the deliberate relocation of a substantial portion of the U.S. production base overseas through outsourcing and FDI, and (3) the rapid growth of FDI into the United States, which has stimulated a corresponding increase in “intrafirm” trade between foreign parents and their U.S. affiliates. However, before examining the causes of the trade deficit in greater detail, it is useful to review the United States’ trade performance relative to other nations.
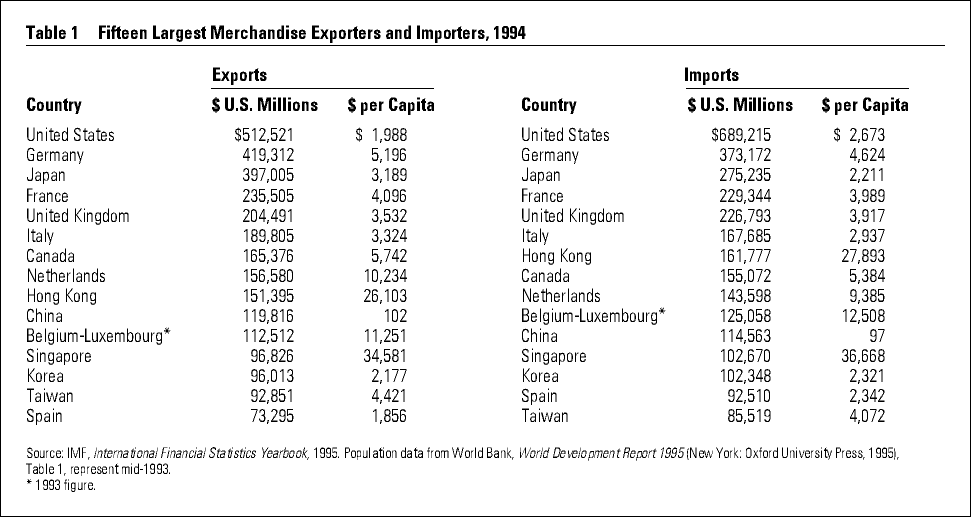
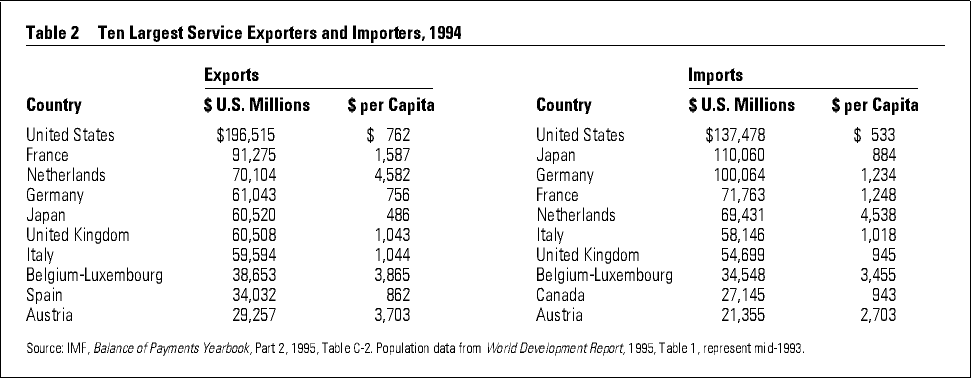
Although the United States has been the world’s largest exporter — and importer — of both goods and services in most years since 1950, its share of world exports has steadily declined, falling from 14.7 percent in 1970 to 12.2 percent in 1994. Conversely, the U.S. share of world imports grew from 13.9 percent in 1970 to 15.9 percent in 1994. In 1994, the United States exported roughly $500 billion in merchandise and $200 billion in services, and imported about $670 billion in goods and $140 billion in services. The result was a $170 billion deficit in merchandise trade and a $100 billion deficit in trade in goods and services.5
The data in Tables 1 and 2 make several interesting points. First, despite the rapid growth of traded services, trade in merchandise remains far more important to most countries. One reason for this disparity is the “local” nature of many services — such as government, utilities, banking, finance, and professional services — which severely restricts opportunities for trade.6 In addition, important services such as transportation, banking, and finance have been heavily regulated until quite recently, limiting foreign participation. Although the General Agreement for Tariffs and Trade (GATT) and North American Free Trade Agreement (NAFTA) liberalize trade and investment in many service industries, these accords are likely to generate more foreign investment than trade, particularly in the banking, finance, and telecommunications sectors. As a result, trade in merchandise should continue to exceed trade in services for some time to come.
Second, large disparities are evident in trade on a per capita basis. In 1994, Singapore, the largest exporter of goods per capita, exported nearly thirteen times as much per person as the United States, the largest exporter. Similarly, the Netherlands, the largest exporter of services per capita, exported about six times as much per person as the United States, the largest service exporter. Of the fifteen largest merchandise exporters, only China and Spain exported less per person than the United States in 1994; of the ten largest service exporters, only Germany and Japan exported less per person. Thus, while the United States remains the world’s premier exporter of goods and services, its performance is far less impressive when the size of its population is taken into account.
Finally, the economic importance of trade differs greatly across countries. In the early 1990s, merchandise exports and imports each averaged about 100 percent to 150 percent of GDP in Hong Kong and Singapore, 50 percent to 75 percent of GDP in Belgium and the Netherlands, but less than 10 percent in the United States and Japan.7 This may explain why the trade deficit has received so little serious attention in Washington.
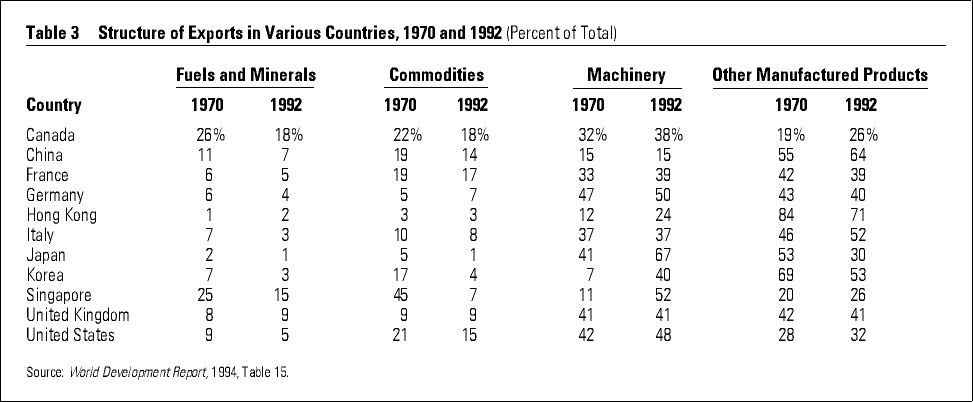
Tables 3 and 4 provide data on the composition of merchandise exports and imports in 1970 and 1992 for a number of leading exporters. Although the categories in these tables are quite broad and some variation in reporting may exist across countries, the tables offer several valuable insights. In general, exports of fuels, minerals, and other primary commodities became relatively less important, while exports of machinery and equipment and other manufactured products became more important during the period. However, there is considerable variation in the trade patterns of individual countries. For example, in 1992, exports of fuels and other commodities accounted for 36 percent of all Canadian exports and 20 percent to 25 percent of all Chinese, French, and U.S. exports. Conversely, exports of industrial and manufactured goods accounted for 97 percent of Japanese exports, 95 percent of Hong Kong exports, and 93 percent of Korean exports.
Imports of food, fuels, and other primary commodities also became relatively less important between 1970 and 1992, as imports of machinery and equipment grew in all countries during the period. In 1992, manufactured products accounted for 75 percent to 85 percent of the imports of all countries except Italy, Korea, and Japan. Machinery and manufactured goods accounted for only 47 percent of Japanese imports and 63 percent of Korean imports in 1992. Interestingly, Japanese imports of food, fuel, and other commodities actually increased over the period, rising from about 38 percent of total imports in 1970 to 40 percent in 1992. This lends some credence to Japan’s claim that it must export manufactured products in order to satisfy its high demand for imported food and fuels. Finally, these trends support Drucker’s argument that primary products have become a less important source of competitive advantage during the past several decades.
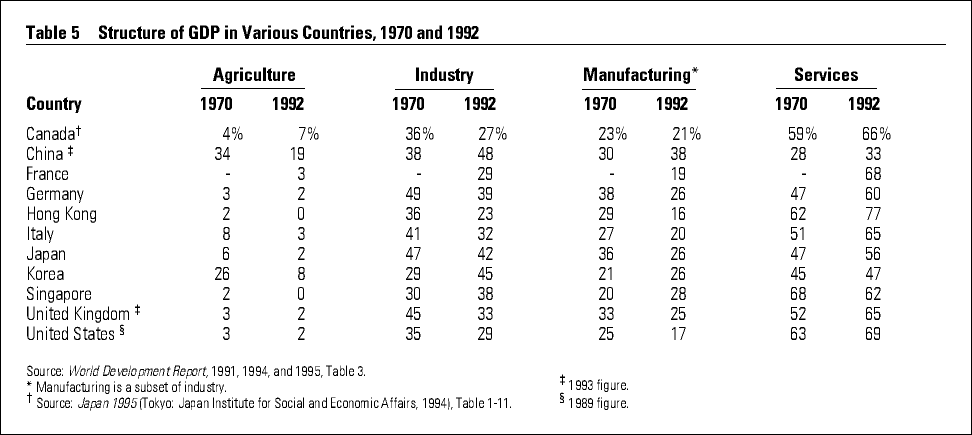
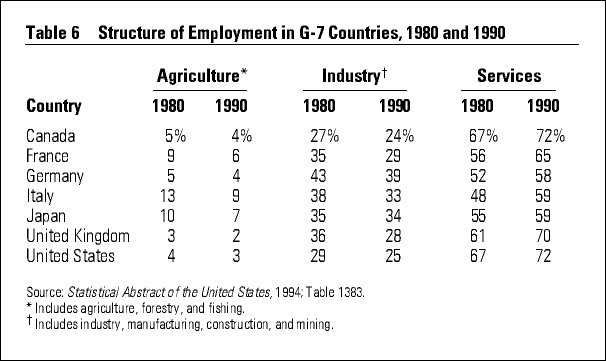
The changing composition of exports and imports closely mirrors the changing structure of production and employment. Table 5 details the structure of production in 1970 and 1992 for the same group of countries, while Table 6 provides information on the structure of employment in 1980 and 1990 for the G-7 only. Based on these tables, we can draw a simple conclusion: since 1970, there has been a profound shift in the distribution of economic activity from agriculture and industry into services. Only China, Korea, and Singapore derived a greater portion of their GDPs from industry in 1992 than in 1970. By the early 1990s, the service sector accounted for the highest portion of total economic activity in Hong Kong, the United States, and France; and service industries employed a greater portion of the labor force in the United States than any G-7 country except Canada. Conversely, China, Germany, Japan, Korea, and Singapore derived a greater portion of their GDPs from the industrial sector in general, and manufacturing in particular, than other leading exporters. Manufacturing as a percentage of GDP in the United States was only about half the level in China in the early 1990s and 60 percent to 65 percent the level in Germany, Japan, Korea, and Singapore. This is important because it explains both the United States’ declining competitiveness in the manufacturing sector and its continued dependence on manufactured and industrial imports from Germany, Japan, and the Asian “tigers” — Hong Kong, Singapore, South Korea, and Taiwan.
Together, the nations listed in Table 7 accounted for roughly 70 percent of all U.S. trade flows. Canada, Japan, and Mexico were the largest U.S. trading partners in 1994, accounting for 40 percent to 45 percent of all merchandise trade. Although some increase in U.S. trade with Canada and Mexico has occurred as a result of the NAFTA, these same three countries have accounted for a similar proportion of U.S. trade flows for more than a decade. Perhaps the most important change that has occurred in U.S. trade patterns since the early 1980s has been the rapid expansion of Chinese imports. In 1994, China was the source of more than 6 percent of all U.S. imports and generated America’s second largest bilateral deficit — $32 billion — behind the $69 billion deficit with Japan. Further, while U.S. imports from Japan stabilized in the early 1990s (at roughly $100 billion), Chinese imports continued to grow at an alarming rate, increasing from roughly $16 billion in 1990 to more than $41 billion in 1994.8 Given China’s extremely low level of exports per capita (see Table 1) and high level of manufacturing as a percentage of GDP (see Table 5), China could soon replace Japan as America’s major source of trade tension.
Finally, a large portion of U.S. trade with specific countries is associated with outward and inward foreign direct investment. For example, in 1992, about 45 percent of U.S. trade with Canada and 33 percent of trade with Mexico consisted of “intrafirm” trade flows between U.S. parents and their affiliates in these countries. Conversely, intrafirm trade between Japanese parents and their affiliates in the United States accounted for an astounding 85 percent of all U.S. trade with Japan in 1992.9
Explaining the U.S. Trade Deficit
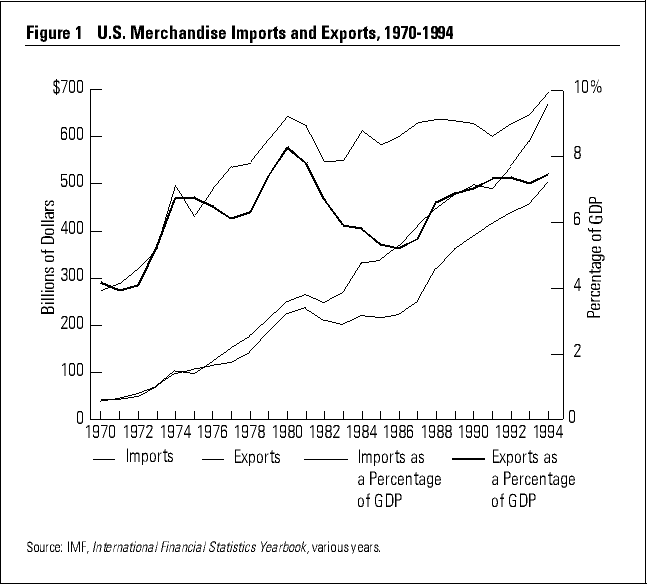
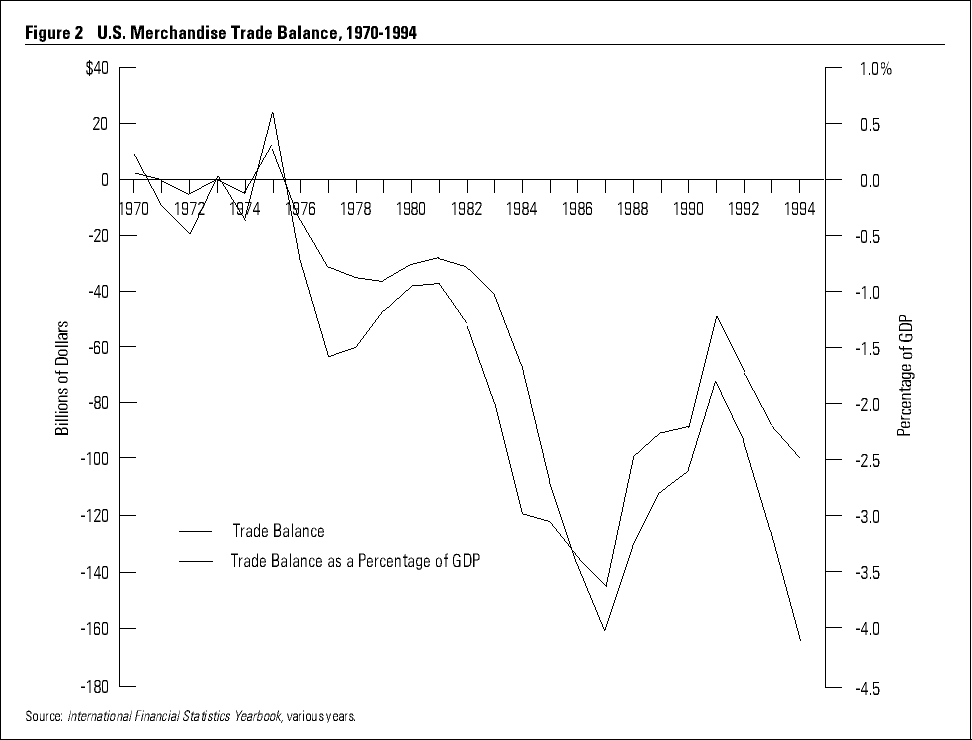
Between 1900 and 1970, the United States experienced only one deficit in merchandise trade — in 1935 at the height of the Great Depression.10 Since 1970, the United States has experienced only two trade surpluses — in 1973 and 1975. Figure 1 shows trends in U.S. merchandise exports and imports in both billions of dollars and as a percentage of GDP between 1970 and 1994. Figure 2 depicts the trade balance during this period. From 1970 to 1980, U.S. exports and imports grew from about 5 percent of GDP each to 8 percent to 9 percent each. The U.S. trade deficit remained unremarkable until the mid-1970s, when it began to expand rapidly, reaching 1.5 percent of GDP in 1977. After contracting somewhat in the late 1970s, the trade deficit deteriorated steadily after 1982 and reached its nadir (as a percentage of GDP) in 1987, when it averaged 3.5 percent of GDP. Between 1987 and 1991, the trade balance improved markedly but, after 1991, expanded again, reaching a record $170 billion in 1994. In the two decades following the last trade surplus, the United States imported over $1.5 trillion more goods than it exported.
The cause of the trade deficit has been the subject of much debate.11 In the 1996 Economic Report to the President, the Council of Economic Advisers argues that a trade deficit occurs when a country’s expenditure exceeds its production. From the council’s perspective, the current account balance — which adds net interest and investment earnings from foreign assets, and net international transfers to the balance of goods and services — is the more appropriate measure because it represents the net income a country receives from the rest of the world. A current account surplus indicates that a country is accumulating foreign assets, while a current account deficit (CAD) signifies that it is borrowing from abroad. The United States has had an erratic CAD since the early 1980s. In 1994, it totaled $150 billion.12 Because a country’s net borrowing is simply the sum of net borrowing by its public sector (federal, state, and local governments) and private sector (firms and households), the current account deficit (CAD) can be rewritten as:

where G is government spending, T is tax revenue, I is investment, and S is saving. Thus, (G – T) is net public borrowing and (I – S) is net private borrowing.13 According to the council, “The crucial insight of [the equation] is that the current account deficit is a macroeconomic phenomenon: it reflects an imbalance between national saving and national investment. The fact that [the equation] is an identity and always holds true also means that any effective policy to reduce the current account deficit must, in the end, narrow the gap between U.S. saving and U.S. investment.”14
Although the council’s analysis is theoretically sound, its conclusions are highly misleading. Consider a case in which saving and investment are equal. Under these conditions, the CAD varies directly with the public-sector deficit and is unaffected by changes in savings and investment. Similarly, it is possible for the gap between private saving and investment to widen at the same time that the current account deficit contracts if net public borrowing decreases accordingly. The equation merely describes the (theoretical) relationships among the CAD, the public-sector deficit, and the difference between saving and investment; it says nothing about the magnitude or direction of the change in one of these factors in response to a change in another.
To predict movements in the three major components of the equation, it is necessary to examine trends in the various components of the current account, public spending and revenue, and private saving and investment. There are compelling reasons to believe that the U.S. current account deficit is structural in nature. For example, the trade deficit appears to be structural, net income on U.S. assets abroad has declined unevenly since 1982, and net transfers to foreigners have grown steadily since 1946. In fact, transfers to the United States have exceeded transfers from the United States only once since the end of World War II — in 1991, when the United States received roughly $40 billion from foreign governments to help defray the cost of the Gulf War.15 Similarly, despite a reduction in the federal budget deficit during the Clinton administration and ongoing efforts to reduce government spending, without a significant change in entitlement spending or a substantial increase in tax revenue, government borrowing is projected to explode early in the next century.16 Finally, the U.S. savings rate has declined erratically for decades.17 Given these trends, one could instead argue that reducing the gap between U.S. saving and investment will require an effective policy to reduce the current account and public-sector deficits.
Traditional macroeconomic explanations notwithstanding, the U.S. trade deficit is a necessary consequence of the structural shift of the U.S. economy away from manufacturing into service, and the related decision by many U.S. firms to move a substantial portion of their manufacturing activities to foreign locations. As a result, a growing portion of U.S. demand for industrial and consumer products is now satisfied through imports rather than domestic production.
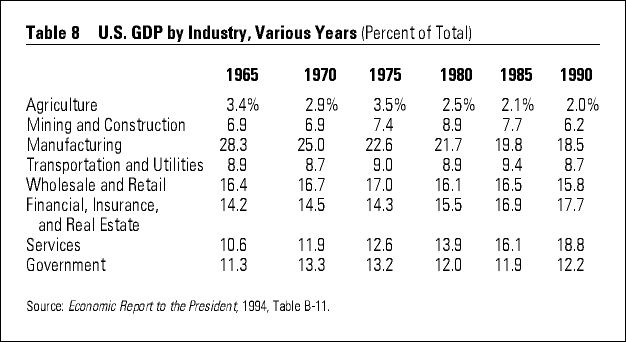
The shift away from manufacturing is clearly evident in Table 8. Manufacturing as a percentage of GDP declined from about 30 percent in 1965 to slightly more than 18 percent in 1990. At the same time, finance, insurance and real estate; services; and government increased from about 35 percent of GDP to almost 50 percent. When transportation, utilities, and wholesale and retail trade are added, nearly three-quarters of the U.S. GDP was derived from the service sector in 1990.18
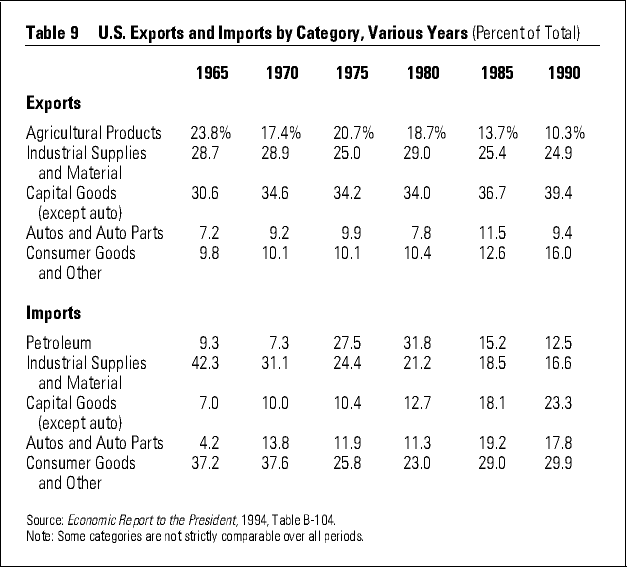
The shift to a service — or postindustrial — economy has made the United States more dependent on foreign imports of industrial and manufactured products and reduced its capacity to export. Table 9 summarizes the changing composition of U.S. exports and imports during the 1965 to 1990 period.19 In 1990, 70 percent of all U.S. imports were manufactured goods (capital goods, autos and auto parts, consumer goods and other), up from less than 50 percent in 1965. Even though 65 percent of all U.S. exports were in these categories, the United States experienced a $75 billion deficit in trade in manufactured products in 1990.20 By 1994, that deficit had risen to more than $125 billion, with trade in autos and auto parts and consumer products accounting for most of the shortfall.21
America’s dependence on foreign manufactured goods helps explain the persistent trade deficit with Japan and the Asian tigers, because these nations have maintained their manufacturing base to a greater extent than other advanced economies (see Tables 5 and 6). Consequently, in 1992, about half of America’s $95 billion in merchandise imports from Japan were capital goods, and almost 20 percent were consumer products not made by U.S. companies, such as fax machines, VCRs, and cameras.22 Similarly, the bulk of U.S. imports from China consisted of light manufactured goods and consumer products such as clothing, footwear, toys, electronics, and small appliances.23 Until the United States starts manufacturing more industrial and consumer products domestically, its trade deficit is likely to continue.
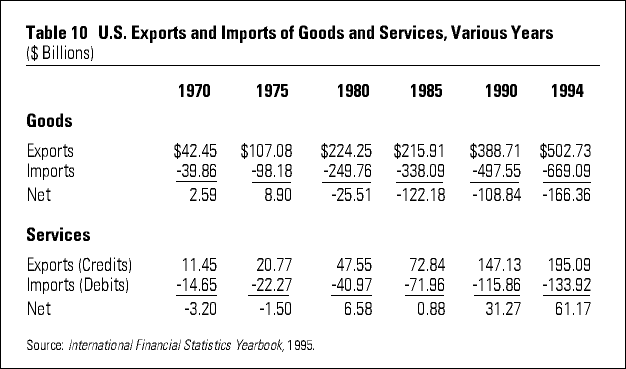
Table 10 shows trends in U.S. exports and imports of goods and services. Trade in services has grown rapidly both in absolute and relative terms, with exports of services (credits) rising from roughly one-fifth of merchandise exports in 1970 to about one-third of merchandise exports in 1994. Since 1989, the United States has generated sizable annual surpluses in traded services, reaching $60 billion in 1994. However, on closer inspection, the bulk of these service exports (credits) were travel related (35 percent of total) or transportation related (25 percent of total), while more than 10 percent were official services and transfers under military grant programs.24 The depreciation of the dollar against key foreign currencies, the slowdown in the U.S. economy in the early 1990s, and the Gulf War explain the recent surpluses in travel services and passenger transportation because these events decreased Americans’ travel abroad and increased foreign tourism in the United States. Although the growing surpluses in traded services are clearly welcome, they continue to fall far short of the much greater deficits in merchandise trade and are likely to do so for the foreseeable future.
The shift to a service economy has done more than have an impact on U.S. trade flows. It has also affected U.S. living standards and competitiveness. For example, productivity growth in the service sector has consistently lagged productivity growth in manufacturing.25 Consequently, as manufacturing as a percentage of GDP has declined, so has the rate of productivity growth in the U.S. economy.26 Similarly, wages in the service sector tend to be lower than wages in the manufacturing sector. In 1992, average hourly earnings for U.S. manufacturing workers were roughly 10 percent higher than average earnings for all U.S. nonsupervisory personnel. Thus, as economic activity has shifted away from manufacturing, the United States has experienced a steady decline in average real wages and weekly earnings.27 There is also a growing recognition that exports of high-value-added services are closely associated with sophisticated industrial exports. Therefore, to remain internationally competitive in the service sector, it is necessary to maintain a competitive manufacturing sector. Finally, by increasing U.S. dependence on foreign sources for many manufactured goods, the shift to a service economy has constrained U.S. foreign policy and sovereignty. An excellent example of this is the short-lived sanctions against certain Chinese imports in early 1995 in response to continued violations of U.S. copyright laws. U.S. trade officials were forced to exclude toys and most electronic components from the list of targeted items because China was the only source for many of these products.28
In short, the U.S. trade deficit has a simple cause: the declining capacity of the United States to manufacture goods in sufficient quantity — and of sufficient quality — to satisfy domestic demand. From this perspective, correcting the trade deficit is equally simple: increase U.S. manufacturing expertise and output. Although similar arguments have been made for decades,29 with the notable exception of encouraging foreign manufacturing investment in the United States, there have been few earnest efforts to expand America’s manufacturing base or create an effective industrial policy.
FDI and the U.S. Trade Deficit
According to Encarnation, “Trade itself has become so closely associated with FDI that all efforts to isolate the relative value of either seem inadequate. Simply put, intracompany shipments between multinational parents and their foreign subsidiaries control international commerce among the industrialized countries.”30 In 1992, intrafirm shipments between U.S. parent companies and their foreign affiliates (i.e., entities in which the parent owns 10 percent or more of the voting stock) accounted for 27 percent of all U.S. merchandise exports and 20 percent of all merchandise imports. Conversely, shipments between foreign parents and their affiliates in the United States accounted for 22 percent of all U.S. exports and 33 percent of all imports.31 Taken together, this means that roughly half of all U.S. trade flows in 1992 were intrafirm trade flows.
Firms have compelling reasons to locate activities in foreign locations, among them increased access to local customers and markets; access to critical raw materials and technologies; lower labor and production costs; government incentives such as tax holidays, supportive infrastructures, and subsidies; circumventing national barriers to trade such as tariffs, quotas, and local content requirements; and reducing the risks associated with exchange rate volatility.32 The proliferation of global strategies in which firms concentrate key activities in specific locations has also encouraged foreign direct investment and intrafirm trade.33 As a result, the trade patterns of individual countries are now increasingly determined by the strategies of individual companies rather than national policies or comparative advantages.
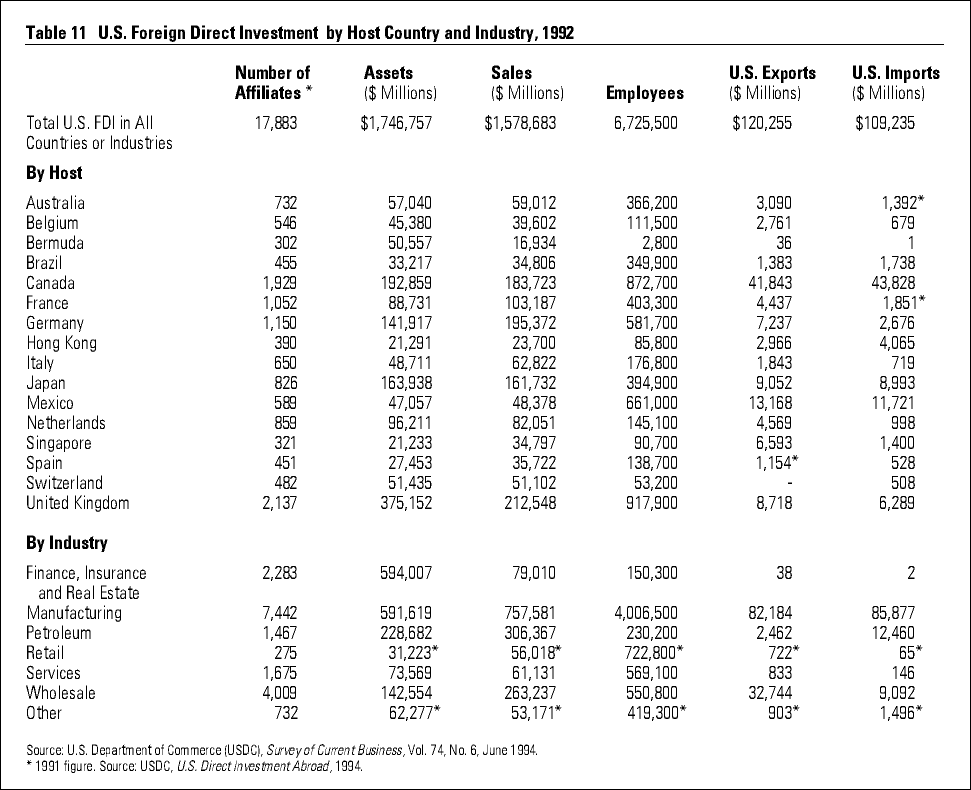
Tables 11 and 12 provide data on stocks of U.S. direct investment abroad and foreign investment in the United States respectively for 1992. These figures are based on the broadest measure of foreign direct investment: affiliates in which the parent owns 10 percent or more of the voting stock. In 1991, U.S. companies had roughly 18,000 foreign affiliates; in 1992, U.S. affiliates abroad had assets worth more than $1.7 trillion (at historical cost), generated nearly $1.6 trillion in revenue, and employed more than 6.7 million foreign workers. The importance of a particular country or industry as a host of U.S. FDI is dependent on the indicator used; however, in general, the United Kingdom and Canada hosted the largest amount of U.S. investment abroad. An interesting picture emerges when we examine U.S. FDI by industry. From this perspective, manufacturing was by far the most important area of U.S. investment abroad. The shift of U.S. manufacturing to low-wage foreign locations began in the 1960s in the apparel, auto, and electronics industries;34 by the early 1990s, most large U.S. manufacturers had established global production systems and were supplying varying portions of their sales in the United States from foreign locations.
In 1991, roughly 42 percent of all U.S. foreign affiliates (7,442 affiliates) were in the manufacturing sector, and, in 1992, U.S. manufacturing affiliates had total assets of $592 billion and employed about 4 million foreign workers. This represented 34 percent of the total assets of all U.S. foreign affiliates and 60 percent of all foreign workers employed by U.S. companies. Excluding manufacturing, U.S. firms had the greatest number of foreign affiliates in the wholesale; finance, insurance, and real estate (hereafter referred to as “finance”); services; and petroleum industries. Finance, manufacturing, petroleum, and wholesale accounted for the greatest amount of asset in 1992, while manufacturing, retail, wholesale, and services employed the greatest number of foreign workers. In 1992, U.S. firms employed nearly 2 million foreign workers in service-related industries (finance, services, wholesale, and retail trade). Finally, U.S. investment in foreign service industries generated only minimal amounts of U.S. exports (and imports), particularly relative to U.S. investment in foreign manufacturing. In 1992, exports to U.S. manufacturing affiliates abroad accounted for 68 percent of all U.S. exports to U.S. foreign affiliates (see Table 11). Conversely, exports to U.S. affiliates in the service sector accounted for less than 30 percent of these trade flows, with the bulk of that total occurring in the wholesale industry. But more importantly, in 1992, almost 80 percent of all imports from U.S. affiliates abroad were manufactured goods, which represented 16 percent of total U.S. imports in 1992.
Perhaps the most important conclusion to draw from this cursory overview of U.S. investment abroad is that, by the early 1990s, U.S. firms had a substantial portion of their foreign direct investments in the manufacturing sector, and (although not shown in Table 11) much of this was concentrated in the transportation equipment, machinery, chemicals, and electronics industries.35 The implication of this finding, while controversial, is clear: many U.S. manufacturers have shifted production to foreign locations in an attempt to increase their access to key foreign markets and/or reduce their production costs by either taking advantage of lower foreign wages or concentrating key activities in order to achieve global economies of scale and scope. However, by servicing foreign markets through local production rather than U.S. exports, the traditional benefits of the firm — employment and training, investment, and tax revenue — accrue to the host country, not the United States. Further, by producing goods abroad for sale in the United States, these foreign investments have contributed to America’s declining manufacturing base and increased the trade deficit.
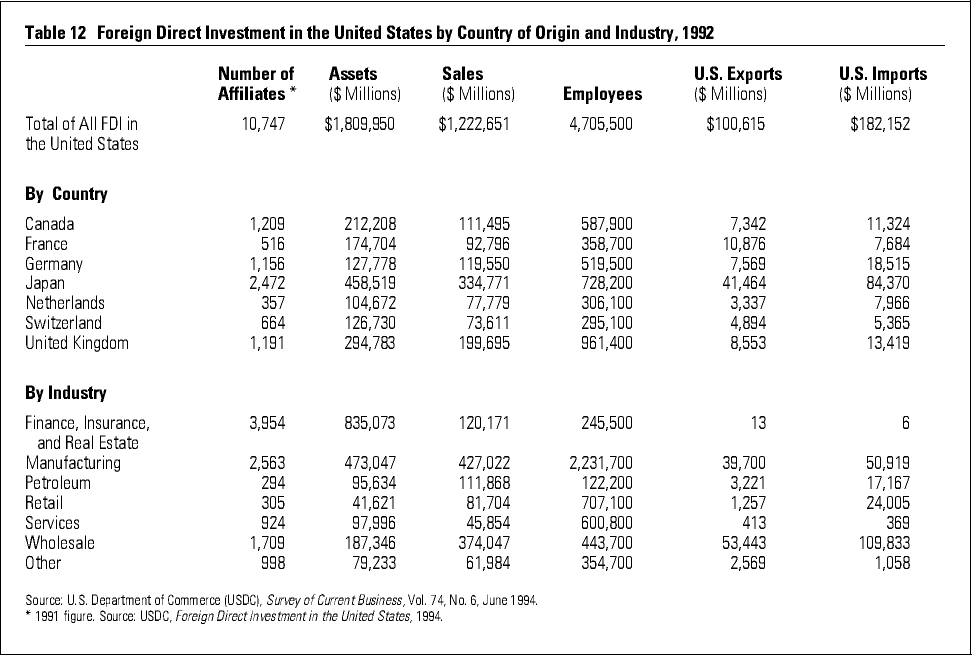
Table 12 presents data on foreign direct investment in the United States. In 1991, foreign corporations owned at least 10 percent of 10,747 affiliates in the United States. In 1992, foreign-owned affiliates had total assets of $1.8 trillion and employed almost 4.7 million Americans, roughly half of whom were in the manufacturing sector. In general, Japanese, British, and Canadian firms were the largest foreign investors in the United States in 1992. Finance, manufacturing, and wholesale emerged as the most important areas of foreign investment in the United States based on both the number of affiliates and total assets, while manufacturing, retail, and services were the most important sources of U.S. employment. Interestingly, manufactured goods made up only about 40 percent of all exports originating in foreign-owned affiliates in the United States in 1992.36 Thus, unlike much U.S. investment abroad, offshore production for export to the home country does not appear to be the primary objective for foreign investment in the United States.
Instead, the purpose of most inward direct investment seems to be either producing goods and services for sale in the United States or establishing a U.S. distribution channel for products manufactured at home. The latter objective is particularly important to Japanese companies, which have made substantial investments in wholesaling in the United States.37 In 1992, Japanese firms exported $84 billion in merchandise to their U.S. affiliates, which represented almost 85 percent of all Japanese merchandise exports to the United States. Finally, to a large extent, the foreign presence in finance and related industries reflects America’s more open regulatory climate, which grants foreign firms greater access to the U.S. market than U.S. firms have been offered abroad. Due to the liberalization of banking and financial services in many countries, however, U.S. investment abroad in finance, insurance, and real estate has grown rapidly in recent years and is likely to continue to grow in the future.
By comparing Tables 11 and 12, we can determine the impact of FDI-related trade flows on the U.S. trade deficit. In 1992, U.S. companies shipped about $120 billion worth of merchandise to their affiliates outside the United States, and those affiliates shipped about $109 billion worth of goods back to the United States, which generated a small $11 billion trade surplus. Conversely, foreign companies exported $182 billion worth of merchandise to their U.S. affiliates in 1992, but those affiliates exported only about $100 billion worth of goods out of the United States, creating an $82 billion trade deficit. When the deficit associated with trade between foreign firms and their U.S. affiliates is added to the surplus generated from trade between U.S. companies and their foreign subsidiaries, the net result was a $71 billion deficit. The point is, if the United States continues to encourage inward FDI, the flow of goods between foreign parents and their U.S. affiliates could place further strain on the U.S. trade deficit.
Based on the preceding analysis, we can draw an important conclusion. Although foreign investment in the United States has clearly contributed to U.S. employment, investment, and even exports, considered in total, it has not compensated for the losses arising from U.S. investment abroad. In 1992, the United States suffered a 2.2 million “job deficit” from FDI, as U.S. firms employed more workers in foreign countries than foreign firms employed in the United States. The vast majority of these jobs — 1.8 million — were in the manufacturing sector. Further, the United States incurred a $71 billion deficit in trade flows associated with inward and outward FDI in 1992, which accounted for nearly three-quarters of the $96 billion U.S. trade deficit that year. Consequently, it is not at all clear that the United States’ liberal attitude toward inward and outward foreign direct investment has been a net benefit to its economy.
Trade, FDI, and the Dollar
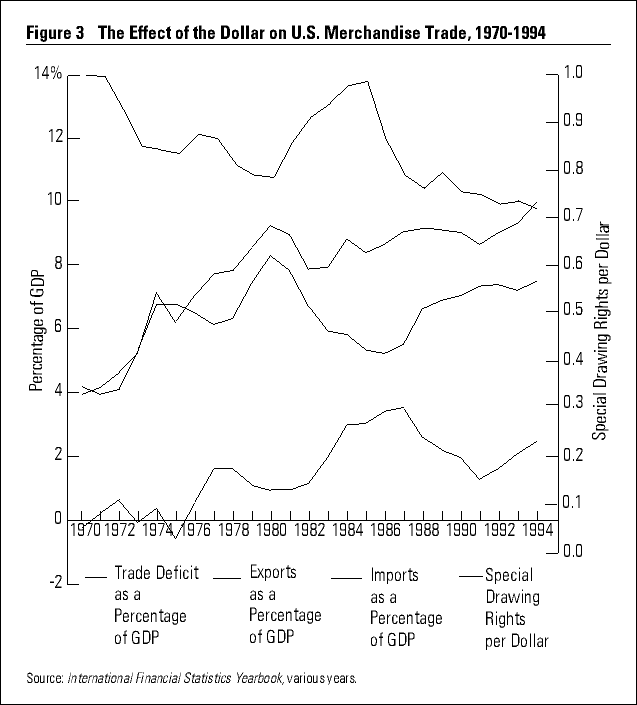
At this point, it is useful to examine the dollar’s impact on U.S. trade and investment patterns. The strength of the dollar in the first half of the 1980s has often been blamed for the U.S. trade imbalance. But while the rapid appreciation and subsequent depreciation of the dollar may explain some of the changes in U.S. trade patterns during the 1980s, its explanatory power is much less impressive during the entire period from 1970 to 1994. Figure 3 shows trends in U.S. exports, imports, and the trade deficit as a percentage of GDP against movements in the dollar. The dollar’s value is measured against the special drawing right (SDR), an international unit of account composed of major international currencies.38 I chose the SDR over other popular measures such as the trade-weighted dollar because it provides a more general indicator of the dollar’s relative value in the international marketplace, and because the dollar’s movements against the SDR have generally been less dramatic than its movements against individual currencies.
Excluding the brief period between 1980 and 1986, the dollar has declined steadily against most major currencies since the early 1970s, falling from $1.00 per 1 SDR in 1970 to $1.00 per .6985 SDR in 1994.39 Theoretically, the dollar’s depreciation should have increased U.S. exports and decreased imports, leading to a reduction in the trade deficit. Conversely, the sharp appreciation of the dollar in the early 1980s should have exacerbated the deficit. As the dollar depreciated between 1970 and 1980, U.S. exports (as a percentage of GDP) increased as expected. Similarly, between 1980 and 1985, there was a decline in U.S. exports. However, as the dollar began its sustained descent after 1985, U.S. exports increased only modestly, growing from 4 percent of GDP in 1986 to roughly 5.5 percent of GDP in 1994. More importantly, however, movements in the dollar have not had the expected effect on U.S. imports. For example, imports increased — not decreased — steadily during the 1970s despite the continued depreciation of the dollar. Similarly, imports decreased as the dollar appreciated in the early 1980s, and the dollar’s decline after 1985 has been matched by a slow increase in imports as a percentage of GDP.
Figures 1 and 3 suggest that U.S. exports and imports are more closely correlated with each other than with movements in the dollar. Correlation analysis supports this. The correlation between annual exports and imports (in billions of dollars) during the 1970 to 1994 period was an incredible .98, nearly perfect positive correlation, while the correlation between exports and imports as a percentage of GDP was .75. Conversely, the correlation between annual exports (in billions of dollars) and the average annual dollar/SDR exchange rate over the period was .77, while the correlation between imports (in billions of dollars) and the dollars/SDR rate was a similar .70.40 (The correlations between exports and imports as a percentage of GDP and the exchange rate were .72 and .65 respectively.) Thus, while the depreciation of the dollar since 1970 has been closely correlated with the expansion of U.S. exports, it has been equally correlated with the growth of U.S. imports. As a result, the sustained devaluation of the dollar has not produced the expected reduction in the trade deficit. In fact, a close inspection of these figures suggests that the trade deficit is more closely related to the state of the U.S. economy than the strength of the dollar, with the deficit widening during economic expansions and contracting during economic slowdowns.41
There are several reasons to expect the value of the dollar to have only a minor effect on U.S. exports and imports, particularly in the short run. The first involves the willingness and ability of U.S. exporters to transmit exchange rate-related price adjustments to foreign consumers. Implicit in the traditional relationship between exchange rates and exports is the assumption that foreign consumers receive the full benefit of the price reductions associated with a devaluation. However, in practice, exporters have little incentive to pass along these savings and, in many cases, are unable to do so.
Consider a U.S. manufacturer that exports “directly” to Japan and thus controls the foreign price of its product. As the dollar depreciates against the yen, the company can lower the yen price of its product and still receive the same revenue in dollars. But the company has little incentive to do so. First, it has no guarantee that the dollar/yen exchange rate will remain at its new level for any length of time. If the manufacturer lowers its price in yen and the dollar returns to its original level, the company must either raise prices or accept a lower dollar revenue. Conversely, if the company does nothing, it will receive a higher dollar price for its product and reap a windfall profit. Second, even if the company does lower its price, there is no guarantee that Japanese consumers will purchase more of its product. In fact, some buyers may view the price decrease as an indication of declining product quality and purchase less of the product. Third, there is the practical consideration of manufacturing and delivering additional merchandise, assuming that a decline in price stimulates demand. Increasing production may require a significant investment in new plant and equipment and the hiring and training of additional workers, and many companies are reluctant to make such investments based on the transitory effects of exchange rates. Thus direct exporters have few incentives to pass along the potential benefits of a devaluation to foreign consumers.
The depreciation of the dollar may have even less impact on “indirect” exports, because a Japanese agent or importer is now responsible for distributing the U.S. product and setting its yen price. Clearly, the agent has no incentive to reduce prices to reflect the product’s lower cost in yen because any exchange rate-related price reduction represents additional profit to the importer. Thus, in practice, foreign consumers may never see the beneficial price effects of the devaluation of an exporter’s currency, and, as a result, the expected increase in exports associated with that devaluation may not materialize.
The steady decline of the dollar since 1985 has also done little to reduce U.S. imports either in dollar value or as a percentage of GDP (see Figure 3). Consider a Japanese company that exports to the United States. In general, it can respond to the depreciation of the dollar (appreciation of the yen) in two ways: it can raise the dollar price of its product to maintain its revenue in yen, or it can continue to charge the same dollar price and accept a lower yen revenue and/or profit. The Japanese firm has several compelling reasons to choose the latter alternative, particularly in the short run. The dollar’s decline may be only temporary, making a price increase unnecessary. U.S. consumers may be unwilling to pay a higher price for the Japanese product. But, most importantly, in capital-intensive industries, maintaining production volume is a higher priority than maintaining product price due to economies of scale (and scope). In industries characterized by large economies of scale, even a small decline in volume can lead to a large increase in production costs. As a result, the Japanese manufacturer may prefer to accept a reduction in revenue and even profit rather than risk a decline in demand associated with a price increase.
Japan’s major exports industries — autos, chemicals, electronics, machine tools, semiconductors, and telecommunications equipment — all generate large economies of scale. As a result, Japanese producers have generally been reluctant to raise the dollar price of their products to compensate for the yen’s appreciation against the dollar. Instead, they have accepted lower profit margins and even losses to maintain demand and keep production at minimum efficient levels.42 To some extent, this explains why the dollar’s continued decline against the yen has had only a minimal impact on Japanese exports to the United States.
The international proliferation of “global” production strategies has also reduced the impact of exchange rates on U.S. imports by enabling foreign firms to export products from third-country locations — particularly in Asia and increasingly in Latin America — in response to the appreciation of their home currencies. Consequently, the depreciation of the dollar may simply shift the source of U.S. imports from Japan or Europe to foreign-owned affiliates in other countries. To the extent that the United States no longer manufactures key consumer and industrial products, the depreciation of the dollar will do nothing more than raise the price of imported goods and increase the trade deficit. The conclusion is clear: the practical mechanics of the export process suggest that currency devaluation no longer provides an effective means for improving a nation’s trade balance.
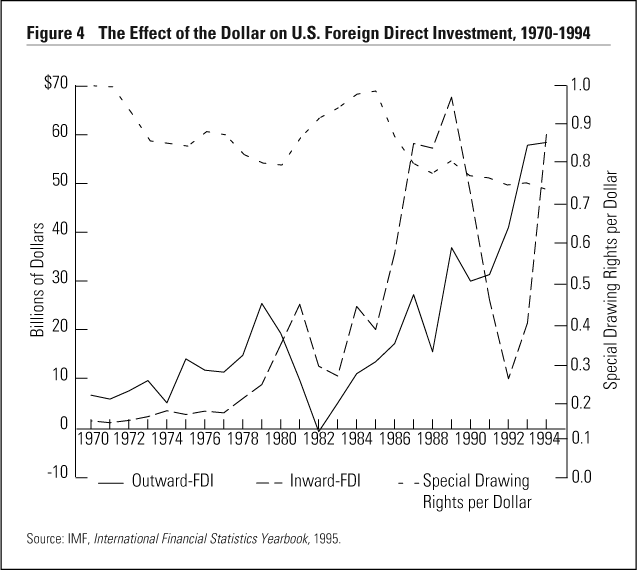
The close link between trade and FDI means that currency movements may also affect international investment decisions. Figure 4 shows annual flows of FDI into and out of the United States in billions of dollars against movements in the dollar during the 1970 to 1994 period. Once again, several interesting patterns are evident. First, FDI into the United States and U.S. investment abroad generally moved in tandem during the period, although flows of FDI into the United States were somewhat more volatile than flows out. Second, in general, these flows were negatively correlated with the value of the dollar, with both inward and outward FDI decreasing as the dollar strengthened in the early 1980s, and increasing as it weakened in the 1970s and late 1980s. The negative association between inward flows of FDI and the dollar’s strength is expected because a strong dollar increases the foreign currency cost of U.S. assets. However, one would expect U.S. investment abroad to be positively related to changes in the dollar, because a strong dollar decreases the dollar cost of foreign assets. Finally, flows of FDI appear to be closely related to the state of the U.S. economy, with both inward and outward FDI increasing during economic expansions and decreasing — sometimes dramatically — during contractions. This suggests that the strength of the U.S. economy is the primary cause of both trade and investment flows, while the value of the dollar is only a secondary factor.
It is useful to examine the effect of the dollar’s depreciation on the attractiveness of the United States as a production and sourcing location. Although the further decline of the dollar against the major currencies might make the United States more attractive relative to high-wage locations such as Japan or Germany, the dollar has tended to appreciate against the currencies of low-wage locations such as China or Mexico. Given the global trend toward lower trade barriers, the proliferation of global and regional free trade agreements, and the declining cost of international transportation, the U.S. necessarily competes with the low-wage nations of Asia and Latin America as a potential production site. Thus, while the continued depreciation of the dollar may encourage some foreign (and U.S.) firms to increase their investment in the United States to supply the U.S. market, the dollar would have to fall to an unacceptably low level to make the United States an attractive location for most global sourcing activities.43
The dollar’s decline in the late 1980s and early 1990s coincided with a precipitous decline in flows of FDI into the United States. According to the Bureau of Economic Analysis (BEA), foreign investors actually removed funds from their U.S. affiliates rather than reinvesting them in the United States. The BEA notes that, in 1993, “For the fifth consecutive year, growth in the [direct investment] position [of foreigners in the United States] was reduced by negative reinvested earnings, which occur when affiliates incur losses or pay dividends to their foreign parents in excess of their current earnings.”44 Japanese firms accounted for more than half of this negative reinvestment. On the other hand, U.S. firms increased their foreign investments during the period despite — or perhaps because of — the declining value of the dollar. Between 1990 and 1993, total U.S. direct investment abroad increased nearly 30 percent. The BEA notes, “Capital outflows for U.S. direct investment abroad were at record levels in 1993. About one-half of the total was accounted for by reinvested earnings, which were boosted by both strong affiliate profits and an unusually high reinvestment rate of .54.”45
To the extent that U.S. exports and imports are associated with foreign investment in the United States and U.S. investment abroad, changes in the value of the dollar will have an uncertain effect on U.S. trade flows. Once a company adopts a global production or sourcing strategy, it becomes extremely costly and inefficient to shift production based on short-term fluctuations in exchange rates. Consequently, unless business decision makers are convinced that an exchange rate movement is permanent, they have little incentive to alter the firm’s production strategy, particularly given the many additional factors that influence the location decisions. Even if they are convinced that a realignment is permanent, it may take years to build a new production facility in the United States. As a result, even though the depreciation of the dollar may encourage additional foreign direct investment in the United States, the ultimate effect of that investment on U.S. exports and imports and the trade deficit is extremely difficult to predict. Given the trends described, we cannot simply assume that additional foreign investment, even in the manufacturing sector, will have a positive impact on the U.S. trade balance.
Conclusion
The U.S. dollar has experienced a sustained decline against the world’s major currencies since 1970, yet during that period, the U.S. trade and current account deficits have grown erratically. The traditional remedy for a chronic trade (or current account) deficit is a currency devaluation. By reducing the cost foreigners pay for domestic products and increasing the cost domestic residents pay for foreign goods, a devaluation theoretically boosts exports and cuts imports, bringing trade flows into balance. Although the logic behind this simple dictum is compelling, it is predicated on the assumptions that currency values are relatively stable and reflect the economic fundamentals of their respective issuers. In fact, the “classical” relationship between exchange rates and trade flows is based on the actions of various “automatic stabilizers” associated with the gold standard, which served to keep trade flows and the current account in balance.46 However, with the advent of “floating” exchange rates in the early 1970s and the subsequent growth and integration of international financial markets, currencies have become commodities and, like commodities, they fluctuate in value based on supply and demand and underlying market sentiments. A recent Bank of Japan study found that nearly 80 percent of the trading on the Tokyo Foreign Exchange Market in 1992 (roughly $3.6 trillion — equivalent to the total value of world exports in that year) was speculative in nature. Conversely, only 12 percent was related to visible trade, and only 8 percent to invisible (services) trade.47 Given the dollar’s prominence in international financial markets, trading in the dollar is almost certainly as speculative. As a result of these and other changes, the link between the dollar and the trade deficit has grown progressively weaker.
I have argued that the fundamental cause of the U.S. trade deficit is the declining capacity of the United States to satisfy domestic demand for manufactured products with domestic production. As a result, each year, Americans purchase more goods from foreign sources than foreigners purchase from the United States. Many U.S. companies have contributed to this situation by shifting a substantial portion of their manufacturing activities overseas and supplying the U.S. market through imports rather than domestic production. In 1992, U.S. corporations imported roughly $110 billion worth of goods from their affiliates outside the United States, a sum equal to about 20 percent of all U.S. merchandise imports. At the same time, foreign firms exported more than $180 billion worth of goods to their affiliates in the United States. This accounted for about 33 percent of all U.S. merchandise imports. Thus, contrary to classical assumptions — in which countries manufacture products based on their local endowments of resources and exchange those goods with other nations possessing a different set of resources —the bulk of contemporary trade takes place between the foreign units of individual companies rather than between independent companies located in foreign countries.
This change has two important implications. As multinational corporations play a greater role in shaping international trade flows, the logic behind those flows will increasingly reflect the strategic decisions of firms rather than the comparative advantages of nations. But, more importantly, by shifting the determinants of international trade from the nation to the firm, the efficacy of traditional macroeconomic policies is greatly diminished. In today’s global economy, a policy that does not affect the production and investment decisions of individual companies — particularly multinational corporations — will not succeed in altering national trading patterns in the long run. The nations that have been most successful in promoting exports — such as Japan and the Asian tigers — have developed policies that give individual firms a strong incentive to increase their export activities.48 On the other hand, countries like the United States that have continued to rely on more traditional mechanisms (such as the exchange rate) have been much less successful.
Exchange rates provide an extremely inefficient means for altering a firm’s production and investment decisions for three reasons. First, the decision to invest or produce in a specific location is long term in nature, and therefore, short-term variations in exchange rates play only a minor role in these decisions. Second, the relative values of currencies do not necessarily reflect the long-term potentials of their respective economies. Consequently, strategic planners are unlikely to use exchange rates as a signal for identifying attractive locations for direct investment. Third, as exchange rates become more volatile and unpredictable, firms have an incentive to shift from exporting to foreign production in order to reduce the effects of unexpected currency movements on revenue and product demand. Although firms can “hedge” many risks associated with exchange rates in future and forward markets, these strategies are often complex and can be expensive. More importantly, managing these risks absorbs valuable resources that could be devoted to the firm’s core businesses.
Taken together, these three factors constrain policy makers’ ability to use exchange rates to influence the sourcing and investment decisions of foreign and domestic firms. They also suggest that a return to a more closely managed or regulated system of exchange rates might be beneficial to both the economies of individual countries and the international economy. A recent study concluded that U.S. economic performance was better under the postwar gold standard (i.e., “fixed” exchange rates) than it has been since currencies began to “float.” Specifically, real rates of GDP, productivity, and wage growth were higher, while inflation, interest, and unemployment rates were lower when the value of the dollar was tied to gold.49 Although a return to the gold standard is highly unlikely, a greater dedication on the part of national and international monetary authorities to reduce the volatility in exchange rates does seem warranted.
Finally, what will happen to the value of the dollar in the future? How will changes in the dollar affect the U.S. trade deficit? Barring a return to “fixed” exchange rates, the value of the dollar will be determined by supply and demand in the international marketplace. Among the factors affecting this determinination are differences between rates of economic growth, inflation, and interest in the United States and other countries; the size of the U.S. trade, current account, and budget deficits; and the demand for dollar-denominated assets by foreign individuals, institutions, and central banks. During the first half of 1996, the dollar rose dramatically against several major currencies — particularly the Japanese yen — due in part to a lower than expected U.S. budget deficit and relatively high returns on U.S. financial assets. Short-term improvements notwithstanding, the dollar should continue to weaken erratically until the United States seriously addresses its budget deficit and $5 trillion national debt. The reason is straightforward. Potential buyers of dollars fear that there will be more dollars in the future due to the persistent budget deficit and excessive debt burden. Thus, like any commodity that is expected to become relatively more plentiful, currency traders are unwilling to pay more for it.
But regardless of the dollar’s future course, the relationship between the dollar and the trade deficit will remain unpredictable. Clearly, to the extent that the United States — or any nation — loses its capacity to manufacture key industrial and consumer products, its ability to export is diminished at the same time its dependence on imports is increased. Under these circumstances, changes in the value of the dollar will have only a minimal effect on the trade deficit. To correct our trade imbalance, U.S. (and foreign) firms will have to make a serious commitment to increase domestic production and stop satisfying U.S. demand with products made abroad. This, in turn, will require a serious reevaluation of the rights and responsibilities of domestically owned firms and the role of government and business in strengthening the U.S. economy. That evaluation, however, is a subject for another inquiry.
References
1. P. Drucker, “The Changed World Economy,” McKinsey Quarterly, Autumn 1986, pp. 2–26.
2. See, for example:
D. Encarnation, Rivals beyond Trade: America versus Japan in Global Competition (Ithaca, New York: Cornell University Press, 1992);
R. Reich, “Who Is Us?,” Harvard Business Review, volume 88, January–February 1990, pp. 53–64; “Who Is Them?,” Harvard Business Review, volume 89, March–April 1991, pp. 77–88; and
D. Yoffie, ed., Beyond Free Trade: Firms, Governments, and Global Competition (Boston: Harvard Business School Press, 1993).
3. In 1970, these exchange rates were: $1 = ¥360, $1 = DM 3.66, and 1£ = $2.40. By early 1995, the appropriate spot rates were roughly: $1 = ¥95, $1 = DM 1.50, and 1£ = $1.60.
4. International Monetary Fund, Direction of Trade Statistics Yearbook (Washington, D.C.: IMF, 1995).
5. International Monetary Fund, International Financial Statistics Yearbook (Washington, D.C.: IMF, 1995). Figures are f.o.b. and were taken from the balance of payments statement for the United States. This explains the slight discrepancies between these figures and those in Tables 1 and 2.
6. B. Scott and G. Lodge made this point more than a decade ago in:
B. Scott and G. Lodge, eds., U.S. Competitiveness in the World Economy (Boston: Harvard Business School Press, 1985), chapter 1.
7. For these 1993 figures, see:
World Bank, World Development Report 1995 (New York: Oxford University Press, 1995), Table 9.
8. Direction of Trade Statistics Yearbook (1995).
9. For information on U.S. trade in 1992, see:
International Monetary Fund, Direction of Trade Statistics Yearbook (Washington, D.C.: IMF, 1994).
For information on intrafirm trade between U.S. parents and their foreign affiliates in 1992, see:
R.J. Mataloni, Jr., “U.S. Multinational Companies: Operations in 1992,” Survey of Current Business, volume 74, June 1994, pp. 42–63.
For information on intrafirm trade between Japanese parents and their U.S. affiliates in 1992, see:
W.J. Zeile, “Foreign Direct Investment in the United States: 1992 Benchmark Survey Results,” Survey of Current Business, volume 74, July 1994, pp. 154–186. See also Tables 11 and 12 in this paper.
10. T. Liesner, One Hundred Years of Economic Statistics (New York: Facts on File, 1989), Table US 16.
11. There are at least two sides to this debate. The first views the U.S. trade deficit as a consequence of declining U.S. competitiveness, particularly in the manufacturing sector. For examples of this approach, see:
M. Blaine, “America’s Competitiveness Paradox,” Business & the Contemporary World, volume 7, 1995, pp. 28–56;
M. Dertouzos, R. Lester, and R. Solow, Made in America: Regaining the Productive Edge (New York: HarperCollins Publishers, 1990);
J. Hart, “A Comparative Analysis of the Sources of America’s Relative Economic Decline,” in M. Bernstein and D. Adler, eds., Understanding American Economic Decline (Cambridge: Cambridge University Press, 1994);
R. Hayes and S. Wheelwright, Restoring Our Competitive Edge: Competing through Manufacturing (New York: John Wiley, 1984); and Scott and Lodge (1985).
The other side of the debate considers basic macroeconomic factors (such as the overvalued dollar, the U.S. budget deficit, and the gap between domestic saving and investment) as the primary cause of the trade deficit. For example, see:
W. Cline, United States External Adjustments and the World Economy (Washington, D.C.: Institute for International Economics, 1989);
R. Dornbusch, “External Balance Correction: Depreciation or Protection?,” Brookings Papers on Economic Activities, no. 1, 1987, pp. 249–269;
P. Krugman, R. Baldwin, B. Bosworth, and P. Hooper, “The Persistence of the U.S. Trade Deficit: Comments and Discussion,” Brookings Papers on Economic Activities, no. 1, 1987, pp. 1–55; and
M. Miller, J. Grant, and G. Thiessen, “Plans to Solve the Problem of the Twin U.S. Deficits,” Canadian Public Policy, volume 15, supplement, February 1989, pp. S58–70.
12. See Economic Report to the President (Washington, D.C.: U.S. Government Printing Office, 1996), Table B–99.
13. A more formal derivation of the equation begins with the basic macroeconomic identity. We know that:
C + G + I + (X – M) = Y = C + S + (TX – TR)
where C is consumption, G is government purchases, I is investment, Y is GNP, TX is taxes paid to government, and TR is transfer payments made by government. By rearranging terms, we find:
[(G + TR) – TX] + (I – S) = – (X – M)
The left side of this equation is the excess of total government spending over tax revenue — or net public borrowing — plus net private borrowing; the right side is the trade deficit.
14. Economic Report to the President (1996), p. 251. See pages 250–259 for the council’s full analysis of the causes and consequences of the U.S. trade deficit.
15. These trends are clearly visible in: Economic Report to the President (1996), Table B-99.
16. For an analysis of the pressures on the federal budget in the future, see:
P. Peterson, Facing Up: How to Restore the Economy from Crushing Debt and Restore the American Dream (New York: Simon & Schuster, 1993).
17. For trends in U.S. saving, see:
Economic Report to the President (1996), Table B-28.
18. Unfortunately, more recent comparable data is unavailable. Tables detailing GDP by industry (formerly Tables B-11 and B-12) were not included in the 1996 Economic Report to the President and seem unlikely to return. This change offers compelling evidence of the perceived unimportance of the source of domestic product (i.e., manufacturing versus services) in Washington.
19. Note that the source for constructing Table 9 differs from the source for Tables 3 and 4. As a result, the product classifications and their respective percentages of U.S. exports and imports may vary slightly between tables.
20. Economic Report to the President (Washington, D.C.: U.S. Government Printing Office, 1994), Table B-106.
21. Economic Report to the President (1996), Table B-102.
22. T. Sekimoto, “Agenda for Global Trade,” Keidanren Review on the Japanese Economy, special issue, May 1995, p. 5.
23. This conclusion is based on an informal study on the origin of various household and consumer products that I conducted in early 1995. I selected a wide range of product categories and surveyed the stores of five large national and regional mass merchandisers to determine the national origin of these products. China was the primary source for footwear and toys in all stores and a major source of clothing and small appliances. Other Asian nations were the primary source for most electronic products, but Chinese goods were also represented. Conspicuously absent in most of these categories were American-made products.
24. International Monetary Fund, Balance of Payments Statistics Year-book, Part 2 (Washington, D.C.: IMF, 1993), Tables C-2 through C-7.
25. For a detailed and somewhat sanguine analysis of U.S. productivity in general and of the service sector in particular, see:
W. Baumol, S.A. Batey Blackman, and E. Wolff, Productivity and American Leadership: The Long View (Cambridge, Massachusetts: MIT Press, 1989).
26. Krugman notes that the two decades since 1970 have seen the lowest productivity growth of the century. See:
P. Krugman, The Age of Diminished Expectations: U.S. Economic Policy in the 1990s (Cambridge, Massachusetts: MIT Press, 1990), chapter 1.
For trends in U.S. productivity growth, see also:
Economic Report to the President (1994), Tables B-47 and B-48.
27. In 1992, average hourly earnings in manufacturing were $11.46, while average earnings in all private industry groups were $10.58. For trends in real wages and earnings, see:
Economic Report to the President (1994), Table B-45.
28. D. Sanger, “President Imposes Trade Sanctions on Chinese Goods,” New York Times, 5 February 1995, p. 1.
29. For a few examples of this approach, see:
Hayes and Wheelwright (1984);
Scott and Lodge (1985);
L. Thurow, “Revitalizing American Industry: Managing in a Competitive World Economy,” California Management Review, volume 27, Fall 1984, pp. 9–41; and
R. Vernon, “Can U.S. Manufacturing Come Back?,” Harvard Business Review, volume 64, July–August 1986, pp. 98–106.
30. Encarnation (1992), p. xi.
31. For information on U.S. trade in 1992, see:
Direction of Trade Statistics Yearbook (1994).
For information on “intrafirm” trade between U.S. parents and their foreign affiliates in 1992, see:
Mataloni (1994).
For information on intrafirm trade between foreign parents and their U.S. affiliates in 1992, see:
Zeile (1994).
32. The factors influencing the location of foreign production and investment are an integral part of the theory of the multinational enterprise. See:
P. Buckley and M. Casson, The Future of the Multinational Enterprise (London: Macmillan Press, 1976);
P. Buckley and M. Casson, Multinational Enterprises in the World Economy: Essays in Honour of John Dunning (Aldershot, United Kingdom: Edward Elgar Publishing Ltd., 1992), particularly chapters 3 and 4;
A. L. Calvet, “A Synthesis of Foreign Direct Investment Theories and Theories of the Multinational Firm,” Journal of International Business Studies, volume 12, 1981, pp. 43–59;
J. Dunning, “Trade, Location of Economic Activity, and the MNE: A Search for an Eclectic Approach,” in B. Ohlin, P.O. Hesselborn, and P.M. Wijkman, eds., The International Allocation of Economic Activity (London: Macmillan, 1977);
J. Dunning, Explaining International Production (London: Unwin Hyman, 1988); and
A. Rugman, ed., New Theories of the Multinational Enterprise (Beckenham, United Kingdom: Croom Helm Ltd., 1982).
33. “Global” strategies were particularly popular in the 1980s. For some of the more notable discussions of these strategies, see:
C. Bartlett and S. Ghoshal, Managing across Borders: The Transnational Solution (Boston: Harvard Business School Press, 1989);
T. Hout, M. Porter, and E. Rudden, “How Global Companies Win Out,” Harvard Business Review, volume 60, September–October 1982, pp. 98–108;
B. Kogut, “Designing Global Strategies: Comparative and Competitive Value-Added Chains,” Sloan Management Review, volume 26, Summer 1985, pp. 15–28;
B. Kogut, “Designing Global Strategies: Profiting from Operational Flexibility,” Sloan Management Review, volume 27, Fall 1985, pp. 27–38;
M. Porter, “Changing Patterns of International Competition,” California Management Review, volume 28, Winter 1986, pp. 9–40; and
C.K. Prahalad and Y. Doz, The Multinational Mission: Balancing Local Demands and Global Vision (New York: Free Press, 1987).
34. For an important early study of the shift of U.S. manufacturers to low wage locations, see:
J.M. Finger, “Tariff Provisions for Offshore Assembly and the Exports of Developing Countries,” The Economic Journal, volume 85, June 1975, pp. 365–371.
35. For a detailed breakdown of U.S. FDI by industry in 1992, see:
Mataloni (1994).
36. To some extent, the relatively low level of manufactured exports from the U.S. affiliates of foreign corporations — and the relatively high level of exports from foreign affiliates in the wholesale industry — may be an artifact of the way the Department of Commerce collects data on foreign investment in the United States. Affiliates are classified by their primary activity. Therefore, some affiliates — particularly Japanese affiliates in the auto industry — are classified as wholesalers even though they may also perform a significant amount of manufacturing or assembly.
37. For a detailed breakdown of Japanese investment in the United States in 1992, see:
Zeile (1994).
38. The basket of currencies that constitute the SDR has changed over time. Since January 1991, these currencies have been the dollar, mark, yen, franc, and pound. The IMF notes that the weights of these five currencies broadly reflects their relative importance in international trade and finance. For a detailed discussion of the SDR, see:
International Monetary Fund, International Financial Statistics Yearbook (Washington, D.C.: IMF, 1993), p. xi.
39. International Monetary Fund, International Financial Statistics Yearbook (1994).
40. Figures for the dollar per SDR exchange rate are from the appropriate series in:
International Financial Statistics Yearbook (1994).
41. The strength of the U.S. economy is based on its annual rate of real GDP growth in:
Economic Report to the President (1994), Table B-5.
42. For example, the average annual returns of Japanese firms in the auto, electronics, and machinery industries declined markedly after 1985 as the yen began to appreciate against the dollar. This suggests that firms in these export-dependent industries were slow to raise the foreign prices of these products and instead accepted a decline in their profit margins. For a discussion of Japanese export behavior and strategies, see:
M. Blaine, “Profitability and Competitiveness: Lessons from Japanese and American Firms in the 1980s,” California Management Review, volume 36, Fall 1993, pp. 48–74; and
S. Cohen, Cowboys and Samurai: Why the United States Is Losing the Battle with the Japanese and Why It Matters (New York: HarperBusiness, 1991), chapters 8 and 9.
Conversely, a study of the behavior of U.S. exporters found that most exporters were unwilling to accept reductions in their profit margins to remain competitive in foreign markets as the dollar appreciated in the early 1980s. See:
V. Hatter, Behavior of U.S. Export Prices and Profit Margins, 1981–1986 (Washington, D.C.: Office of Trade and Investment Analysis, International Trade Administration, U.S. Department of Commerce, 1988).
43. For an analysis of global sourcing strategies, see:
M. Kotahe, Global Sourcing Strategies: R&D, Manufacturing, and Marketing Interfaces (New York: Quorum Books, 1992).
44. S.E. Baragas and J.H. Lowe, “Direct Investment Positions on a Historical-Cost Basis, 1993: Country and Industry Detail,” Survey of Current Business, volume 74, June 1994, pp. 76–77.
45. Ibid., p. 73.
46. For an excellent historical survey of the gold standard and its operations, see:
A.G. Ford, “International Financial Policy and the Gold Standard, 1870–1914,” and
D.E. Moggridge, “The Gold Standard and National Financial Policies, 1913–1939,” both in:
P. Mathias and S. Pollard, eds., The Cambridge Economic History of Europe, Volume VIII, The Industrial Economies: The Development of Economic and Social Policies (Cambridge: Cambridge University Press, 1989), pp. 197–249 and pp. 250–314 respectively.
47. Sekimoto (1995), pp. 5–6.
48. For a summary of the policies that several Asian nations used to achieve rapid growth and increase exports, see:
World Bank, The East Asian Miracle: Economic Growth and Public Policy (New York: Oxford University Press, 1993), particularly chapters 3 and 6.
For an analysis of industrial policies in Japan, Korea, and Taiwan, see: Office of Technology Assessment, Competing Economies: America, Europe, and the Pacific Rim, OTA-ITE-498 (Washington, D.C.: U.S. Government Printing Office, 1991), chapters 6 and 7 respectively.
49. See: R. Forsyth, “The Appeal of Gold,” Barron’s, 19 February 1996, pp 31–34.
For an interesting analysis of the relative virtues of various exchange rate regimes, see:
Economic Report to the President (Washington, D.C.: U.S. Government Printing Office, 1993), pp. 282–308.