Measuring Culture in Leading Companies
Introducing the MIT SMR/Glassdoor Culture 500
Culture Matters for Corporate Performance
On Feb. 5, 2018, Wells Fargo, then the third largest bank in the United States by assets, lost nearly $30 billion in market capitalization in a single day. The Federal Reserve had barred the bank from growing, as a penalty for opening more than 2 million accounts without authorization from customers.1 An investigation commissioned by the bank’s independent directors concluded that the root cause of the fraudulent behavior was the culture of the division whose employees opened the accounts.2
Culture matters. Now we can measure it.
See how major companies in the world economy rank across the nine dimensions of corporate culture, based on more than one million Glassdoor reviews.
The link between a toxic corporate culture and unethical behavior would come as no surprise to most executives. According to a recent survey, 85% of CEOs and CFOs believe that an unhealthy corporate culture leads to unethical behavior.3 The cost of a dysfunctional culture can be substantial. Public companies caught committing corporate fraud lose, on average, 25% to 44% of the value of their equity.4
On the flip side, a healthy company culture can turbocharge corporate performance. The same survey of CEOs and CFOs found that 9 out of 10 believe that improving corporate culture would increase their company’s value, and nearly 80% ranked culture among the five most important factors driving their company’s valuation. A growing body of research by financial economists has shown that a good corporate culture is correlated with higher profitability and returns to shareholders.5 Companies listed among the best places to work based on their corporate culture, for example, delivered nearly 20% higher returns to shareholders than comparable companies over a five-year period.6
Measuring Culture With Glassdoor Data
Culture matters for performance, but how can we quantify corporate culture and compare it across organizations? To understand how a company’s culture plays out in practice, we would need candid data from a large cross section of employees. To dig beneath simplistic assessments of culture as good or bad requires nuanced descriptions of the specific elements of corporate culture that are working well or poorly. Consistent data across a large number of companies is required to benchmark corporate cultures. Finally, linking culture to results requires data that can reliably predict corporate outcomes, financial performance, or innovation.
As it turns out, such a data source exists, and you may have used it when researching potential employers. Glassdoor is one of the largest job and recruiting sites in the world. Since its launch in 2008, Glassdoor has collected more than 49 million reviews and employee insights, covering approximately 900,000 organizations. Employees submit anonymous reviews, which means they can offer their candid opinions without fear of reprisal. Companies, moreover, cannot remove critical reviews. By aggregating these reviews, we can construct a comprehensive picture of a company’s culture that moves beyond the anecdotes and personal observations that managers often rely on to understand their corporate culture.
On Glassdoor, employees rate their company’s culture and values on a five-point scale, but these quantitative scores alone shed little insight on the specifics of a company’s culture. The real value for understanding and measuring culture lies in the free text responses that each reviewer provides. Here, employees describe — in their own words — the pros and cons of working at a particular company and offer advice to management. By analyzing this textual data, we can assess how well a company is doing on critical dimensions of culture — including diversity, collaboration, or integrity — in the eyes of employees.
Glassdoor reviews also provide clues to a company’s future performance. Wells Fargo’s reputation plummeted after regulators announced the bank’s financial fraud, but Glassdoor reviews signaled the bank had a problem with corporate ethics well before the fraud was made public.7 A series of studies have used Glassdoor data to predict a range of corporate outcomes, including future profitability, stock market returns, innovation, customer satisfaction, and financial fraud.8 In the years prior to the scandal, Wells Fargo employees were nearly twice as likely to discuss integrity in their reviews, and half as likely to discuss the bank’s ethics in positive terms compared with other large banks.9
To create the MIT SMR/Glassdoor Culture 500, we analyzed 1.2 million reviews using a natural language processing (NLP) methodology that accurately classifies free text into more than 90 culture-related topics. The combination of Glassdoor’s rich data set and our NLP algorithms allows us to present, for the first time, an online tool to compare the corporate cultures across companies that collectively employ 34 million people — the equivalent of one-quarter of private sector employment in the United States.10 This article describes how we define culture, the advantages of the Glassdoor reviews, how we analyzed the free text, and how to use the Culture 500 interactive tool to see how companies’ cultures stack up.

Defining Culture as Values and Norms
Most large companies describe their official corporate culture in terms of the values they want employees to practice on a day-to-day basis. Over 75% of the Culture 500 companies published an official statement of their corporate culture listing the specific values, such as integrity, customer-centricity, or respect, that together defined the culture the company aspired to achieve.11 Of course, employees do not always live up to their company’s espoused values, but official statements nevertheless shed light on which elements of corporate culture executives consider most important.
For the Culture 500, we follow Charles O’Reilly and Jennifer Chatman, who define organizational culture as “a set of norms and values that are widely shared and strongly held throughout the organization.”12 Shared values express what is important to employees, while norms provide clear guidance on behavior that is consistent with those values. Employees might all agree, for example, that integrity is worthwhile. But an organization needs norms — such as employees speak up when they see ethical breaches and managers protect whistle-blowers — to translate an abstract value like integrity into concrete behavior. This definition has been widely adopted by researchers studying the relationship between corporate culture and performance.13
Identifying the Big Nine Cultural Values
Given the diversity of corporate values across different companies, we faced the practical question of addressing which values matter most. In a separate study, we identified more than 60 distinct values that companies listed in their corporate values statements.14 Measuring and reporting dozens of values would be overwhelming, so we narrowed down the values to the nine that were cited most frequently by companies.15 These values, which we call the Big Nine, are agility, collaboration, customer, diversity, execution, innovation, integrity, performance, and respect.
Big Nine Cultural Values
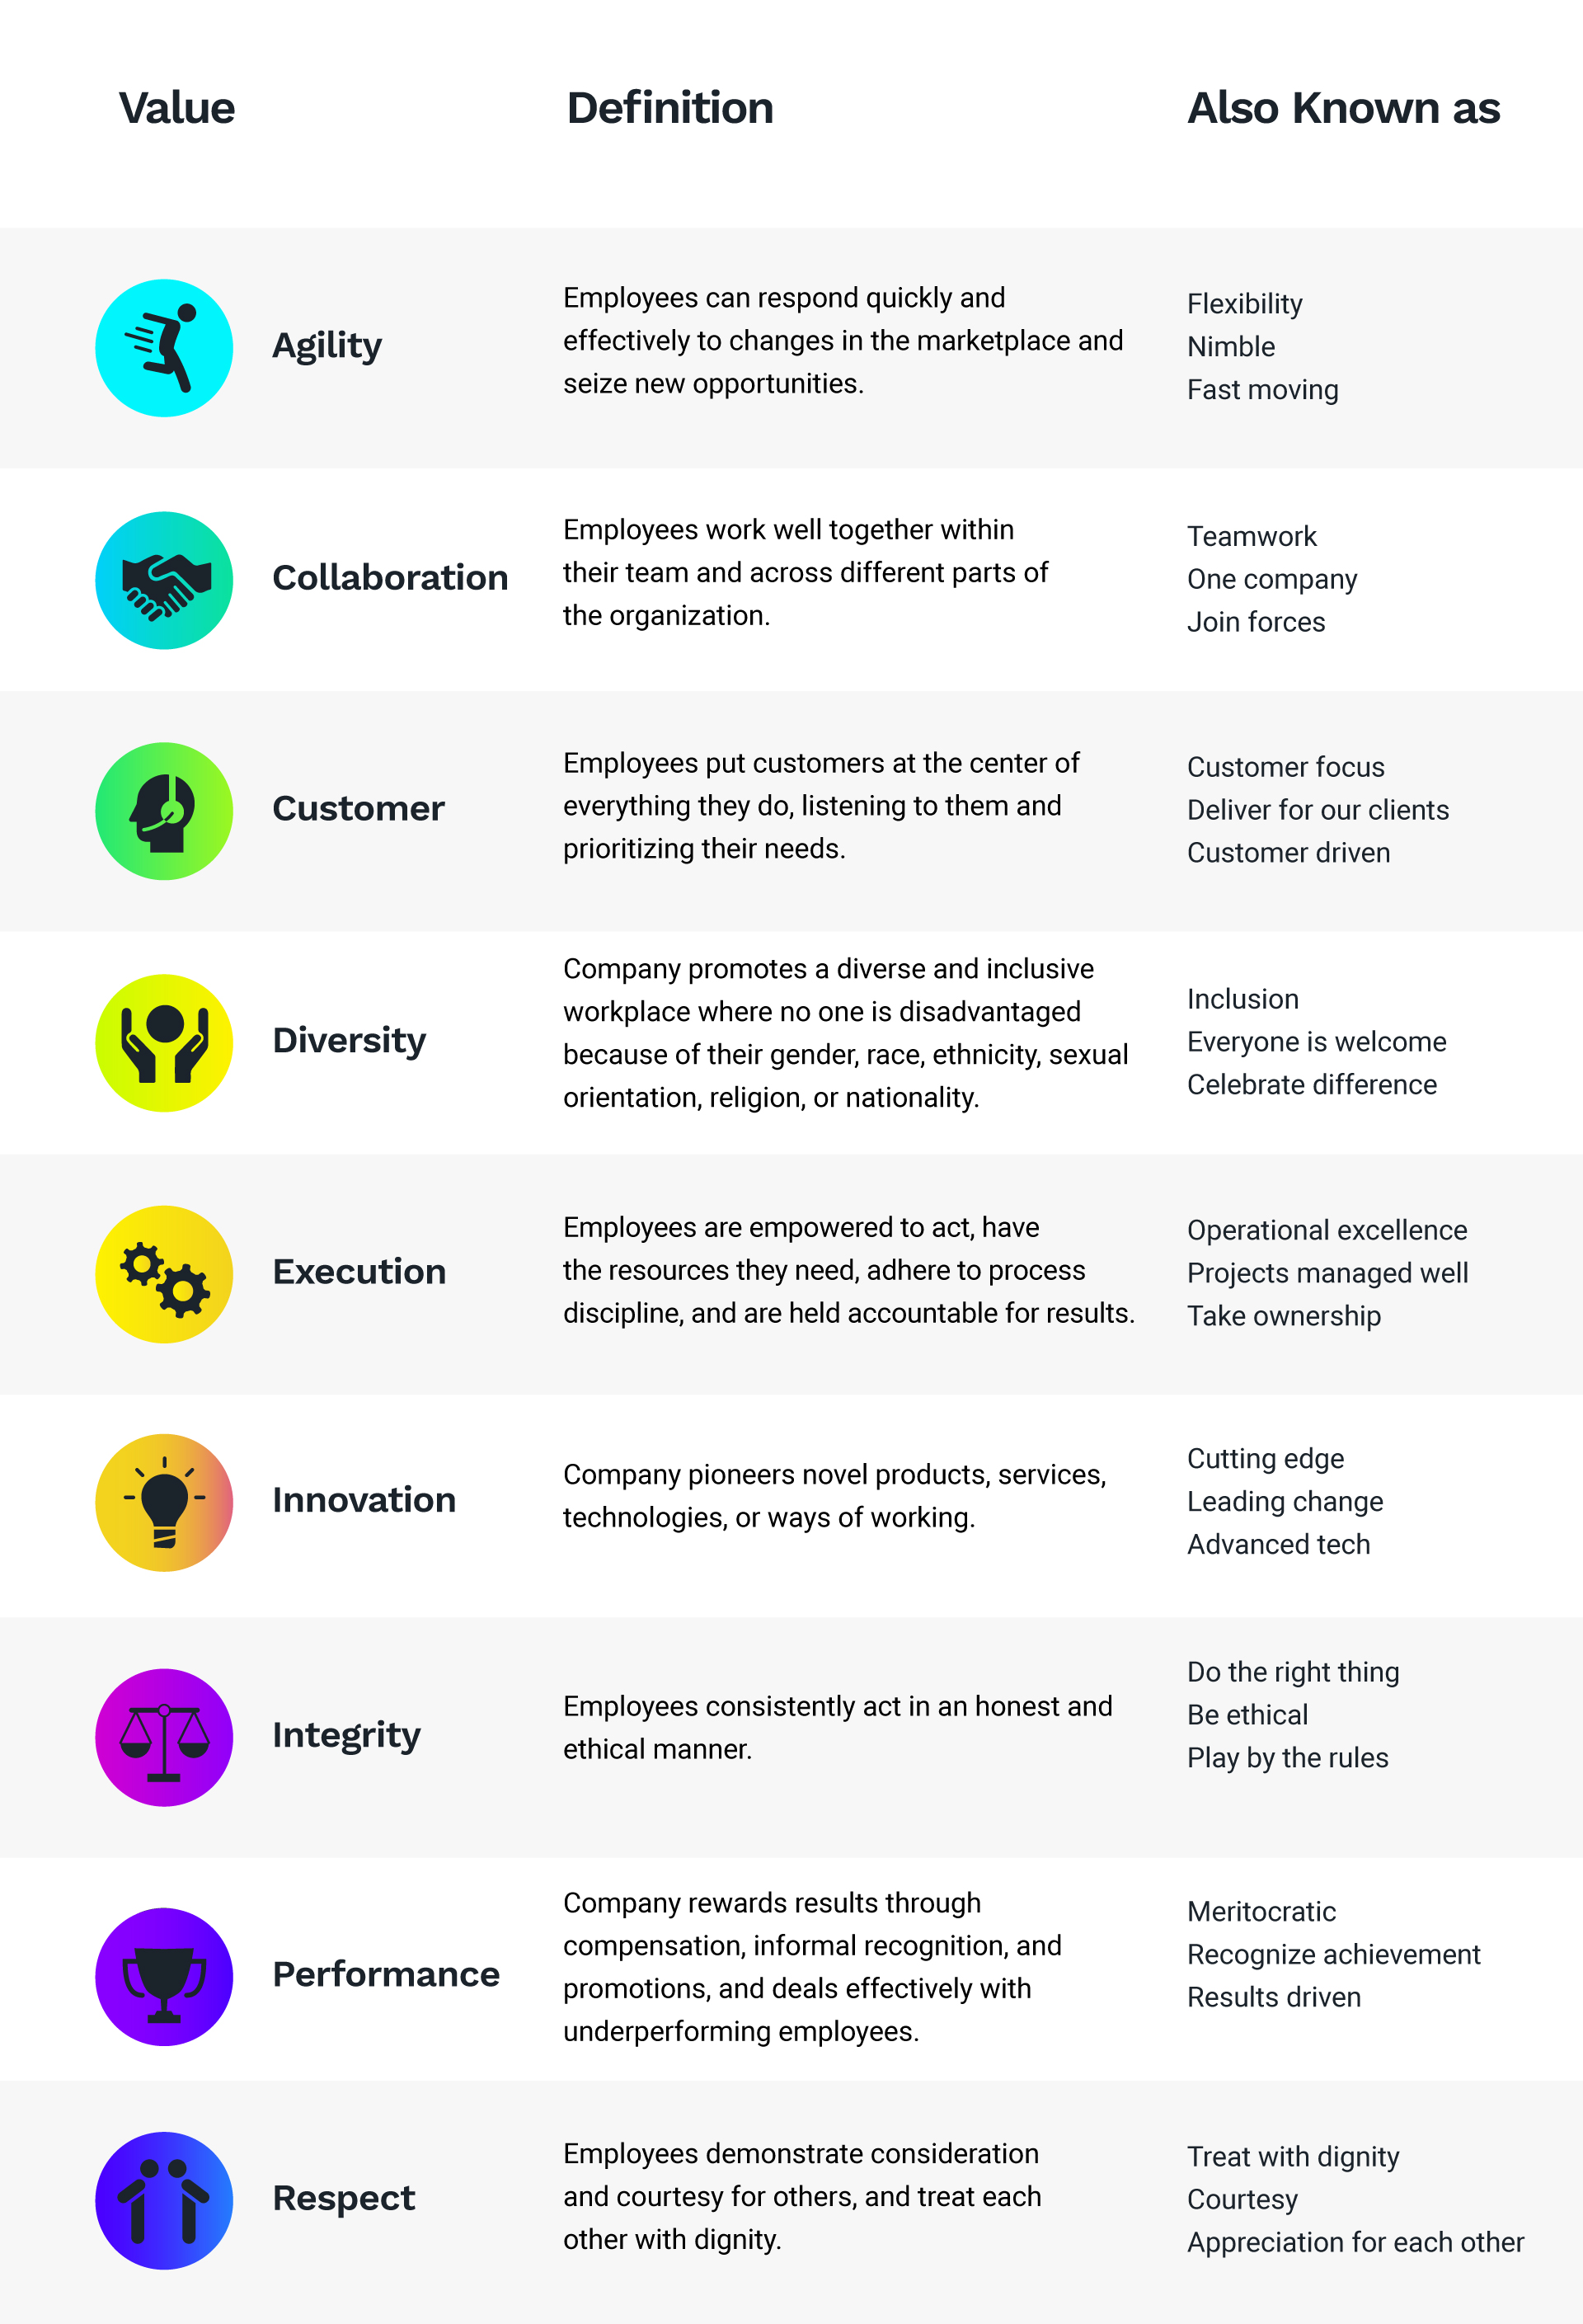
For each of the Big Nine, we calculate the percentage of each company’s Glassdoor reviews that mention the value (incidence) as well as the percentage of reviews that discuss the value in positive terms (sentiment). The Culture 500 interactive tool provides users a snapshot of how frequently and positively employees within a company talk about the Big Nine values.
To illustrate culture at a glance within a company, consider the example of Amazon. (See “What Culture Looks Like at Amazon.”)
What Culture Looks Like at Amazon
This visualization shows how employees at Amazon rate culture across the Big Nine values in Glassdoor reviews. The values are normalized so that 0 is the average score for each Big Nine value for the company, and the axis labels denote standard deviations above or below the average when it comes to frequency (how often employees discuss this value) and sentiment (how positively employees discuss this value).
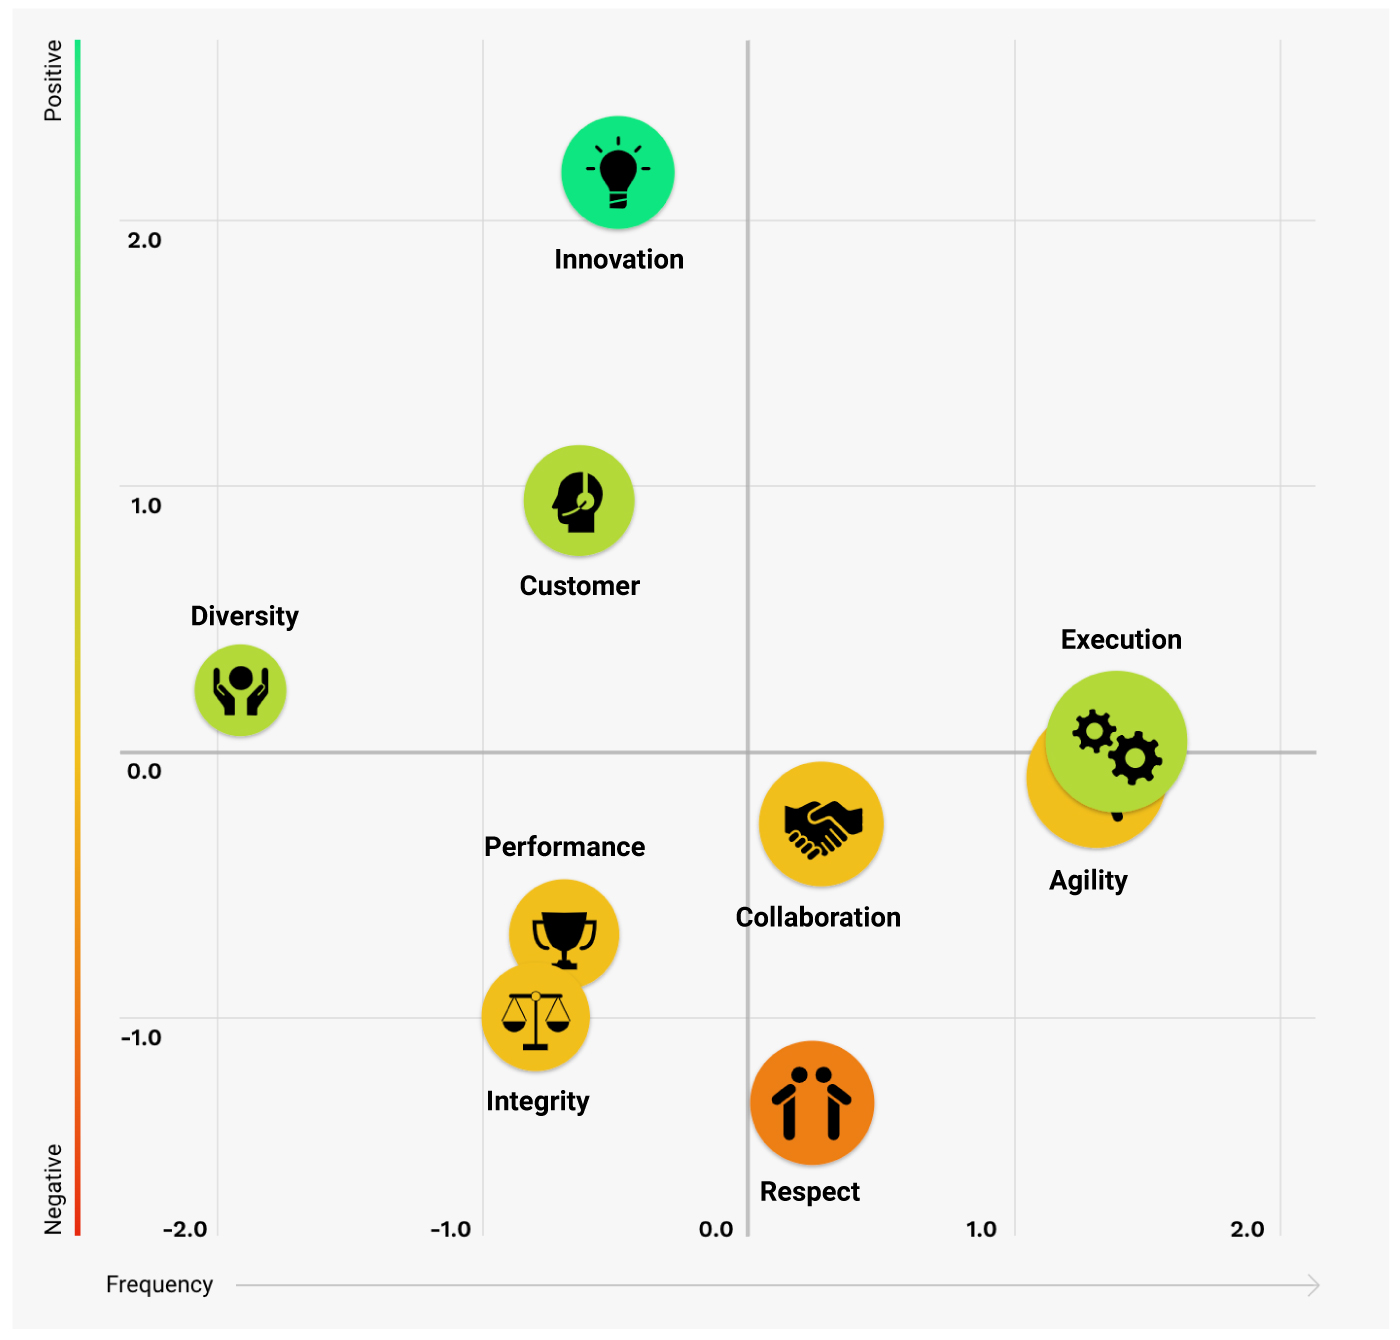
Consistent with the company’s official culture, which emphasizes customer obsession and innovation, we see that Amazon employees were most positive about innovation and assessed the retailer’s customer orientation very favorably as well. On the negative side, Amazon employees were much less enthusiastic about how well the company respects its workers.
Internally, Amazon employees rate the company highly on innovation, but how does Amazon stack up to other large information technology companies when it comes to innovation? The Culture 500 allows users to benchmark companies against their competitors on each of the Big Nine values. (See “How Tech Giants Compare on Innovation.”)
How Tech Giants Compare on Innovation
This visualization shows how companies considered giants in the tech industry measure up on innovation in Glassdoor reviews. The values are normalized so that 0 is the average score for innovation for all tech giants, and the axis labels denote standard deviations above or below this industry average when it comes to frequency (how often employees discuss this value) and sentiment (how positively employees discuss this value).
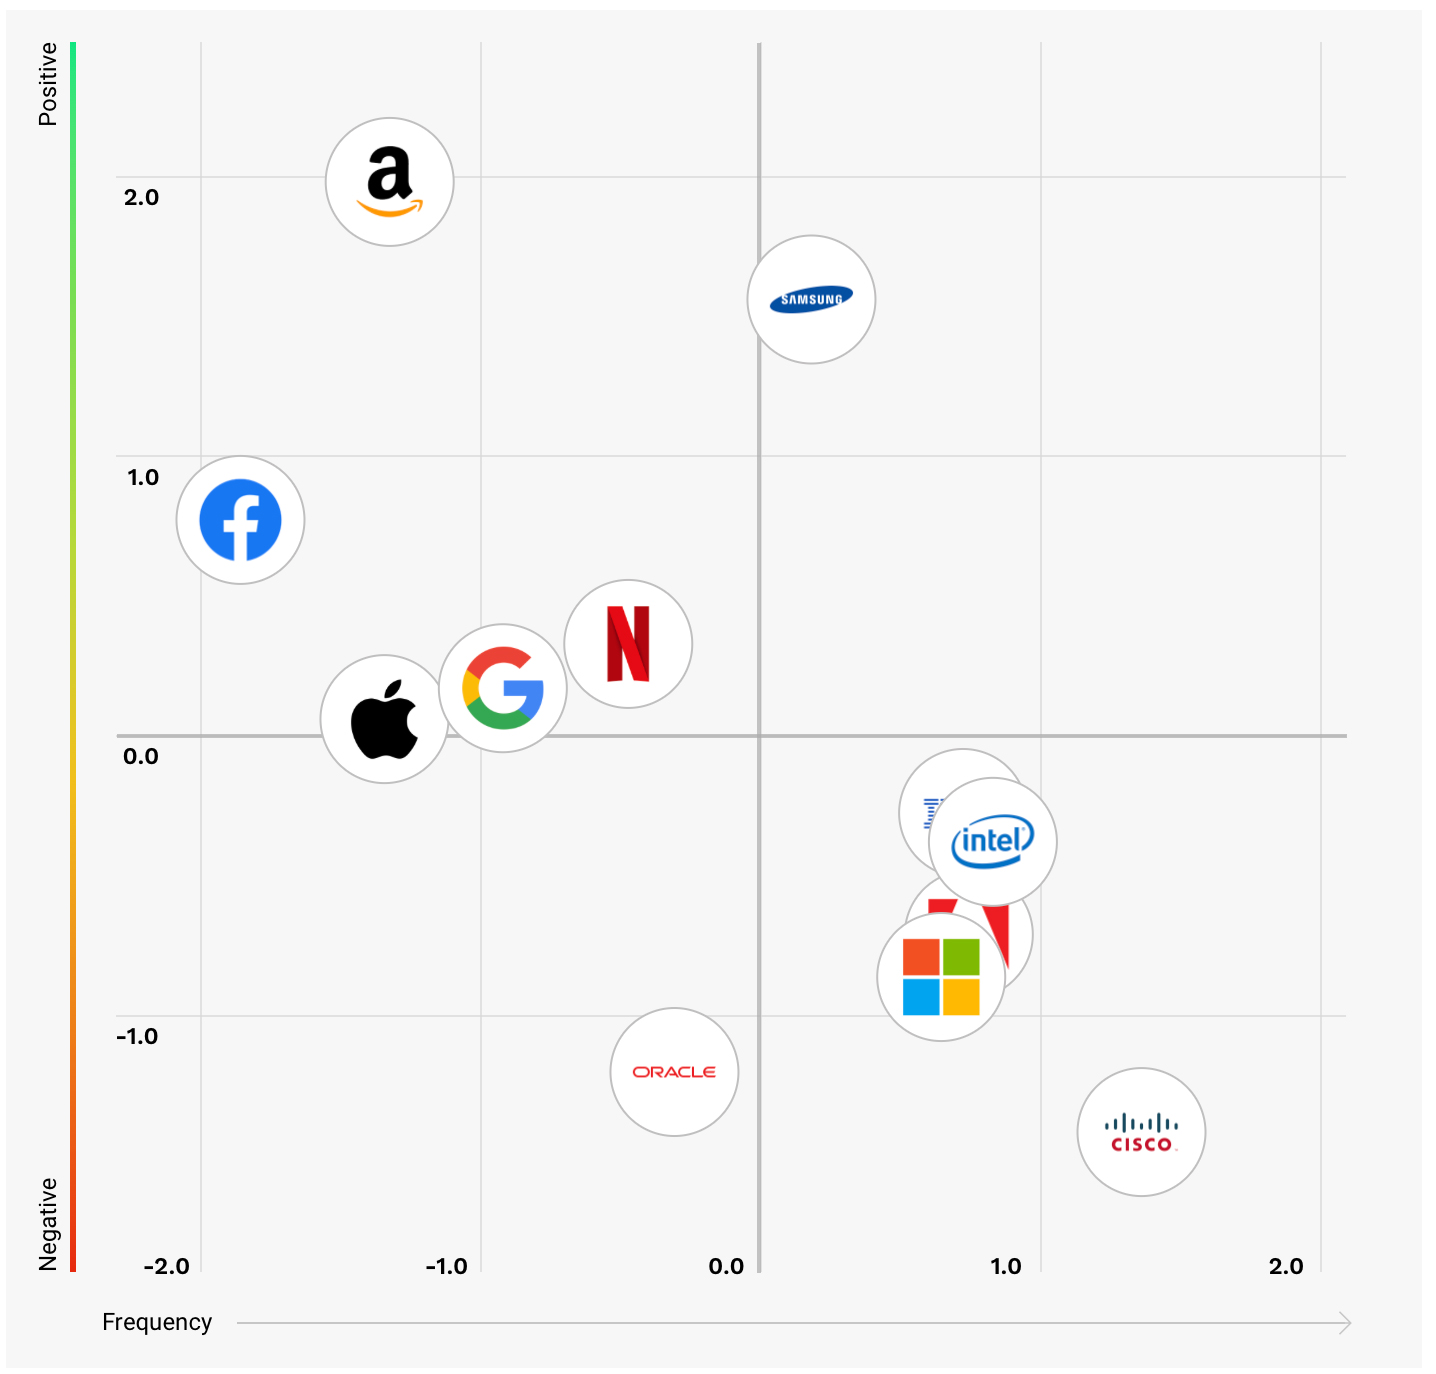
This industry comparison suggests that Amazon excels at innovation, even when benchmarked against other tech giants.
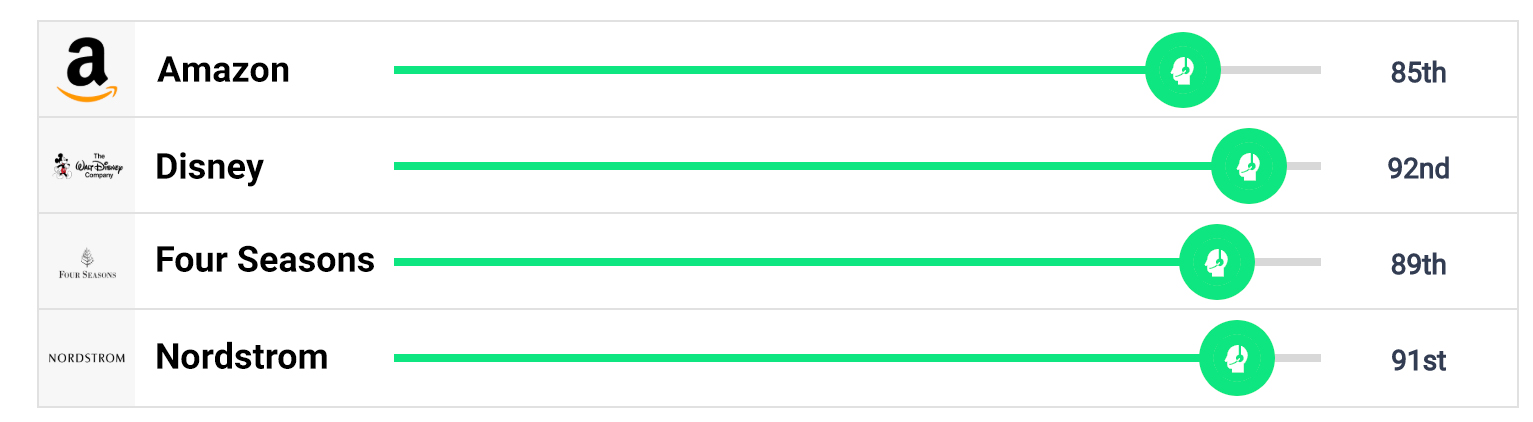
With the Culture 500 interactive tool, users can also construct their own customized set of companies and compare them along any of the Big Nine values. For instance, we can look at how Amazon measures up against companies from other industries — Nordstrom, Disney Parks, and the Four Seasons Hotels and Resorts — that enjoy excellent reputations for customer centricity. (See “Comparing Customer-Centricity Across Different Companies.”)
Comparing Customer-Centricity Across Different Companies
The Culture 500 allows direct company comparisons across industries. Here, we see how customer focus at Amazon compares with other customer-obsessed companies from other industries. The numbers denote percentiles across all companies in the Culture 500 sample.
Using Glassdoor Data to Understand Corporate Culture
Glassdoor is a gold mine of information for job seekers, and the Culture 500 demonstrates how employee reviews can help leaders understand their organization’s culture as well. In their open text responses, employees are free to talk about whatever matters most to them. Nearly all employees — 93% by our analysis — discuss some element of culture in their reviews, and 41% discuss one or more of the Big Nine values.16
Any single review could reflect an employee’s idiosyncratic view, but when hundreds or thousands of reviews are aggregated together, they paint an accurate picture of a company’s culture. The average company in our sample had 2,182 reviews, which represent about 4% of its total employment.17 To put this number in perspective, consider that the typical political poll surveys a sample of 1,000 people — approximately 0.001% of all registered voters in the United States — to assess the political climate.18
Understanding Spikes in Glassdoor Reviews
A large sample of reviews means nothing unless they accurately represent the views of a company’s workforce as a whole. A common concern with online reviews is that they skew toward a polarized distribution with many glowing reviews, a disproportionate number of extremely negative ones, and relatively few moderate opinions. The polarization of online reviews is well documented in a range of settings, from products on Amazon to restaurant reviews on Yelp.19 This polarized pattern occurs when only those users with extremely positive or extremely negative views are motivated to write a review.20
Yelp Versus Glassdoor Reviews
Like many online ratings platforms, Yelp reviews tend toward the extremes of very positive or very negative. Glassdoor minimizes the polarization through a series of user policies, creating a more equal and representative distribution of user ratings.
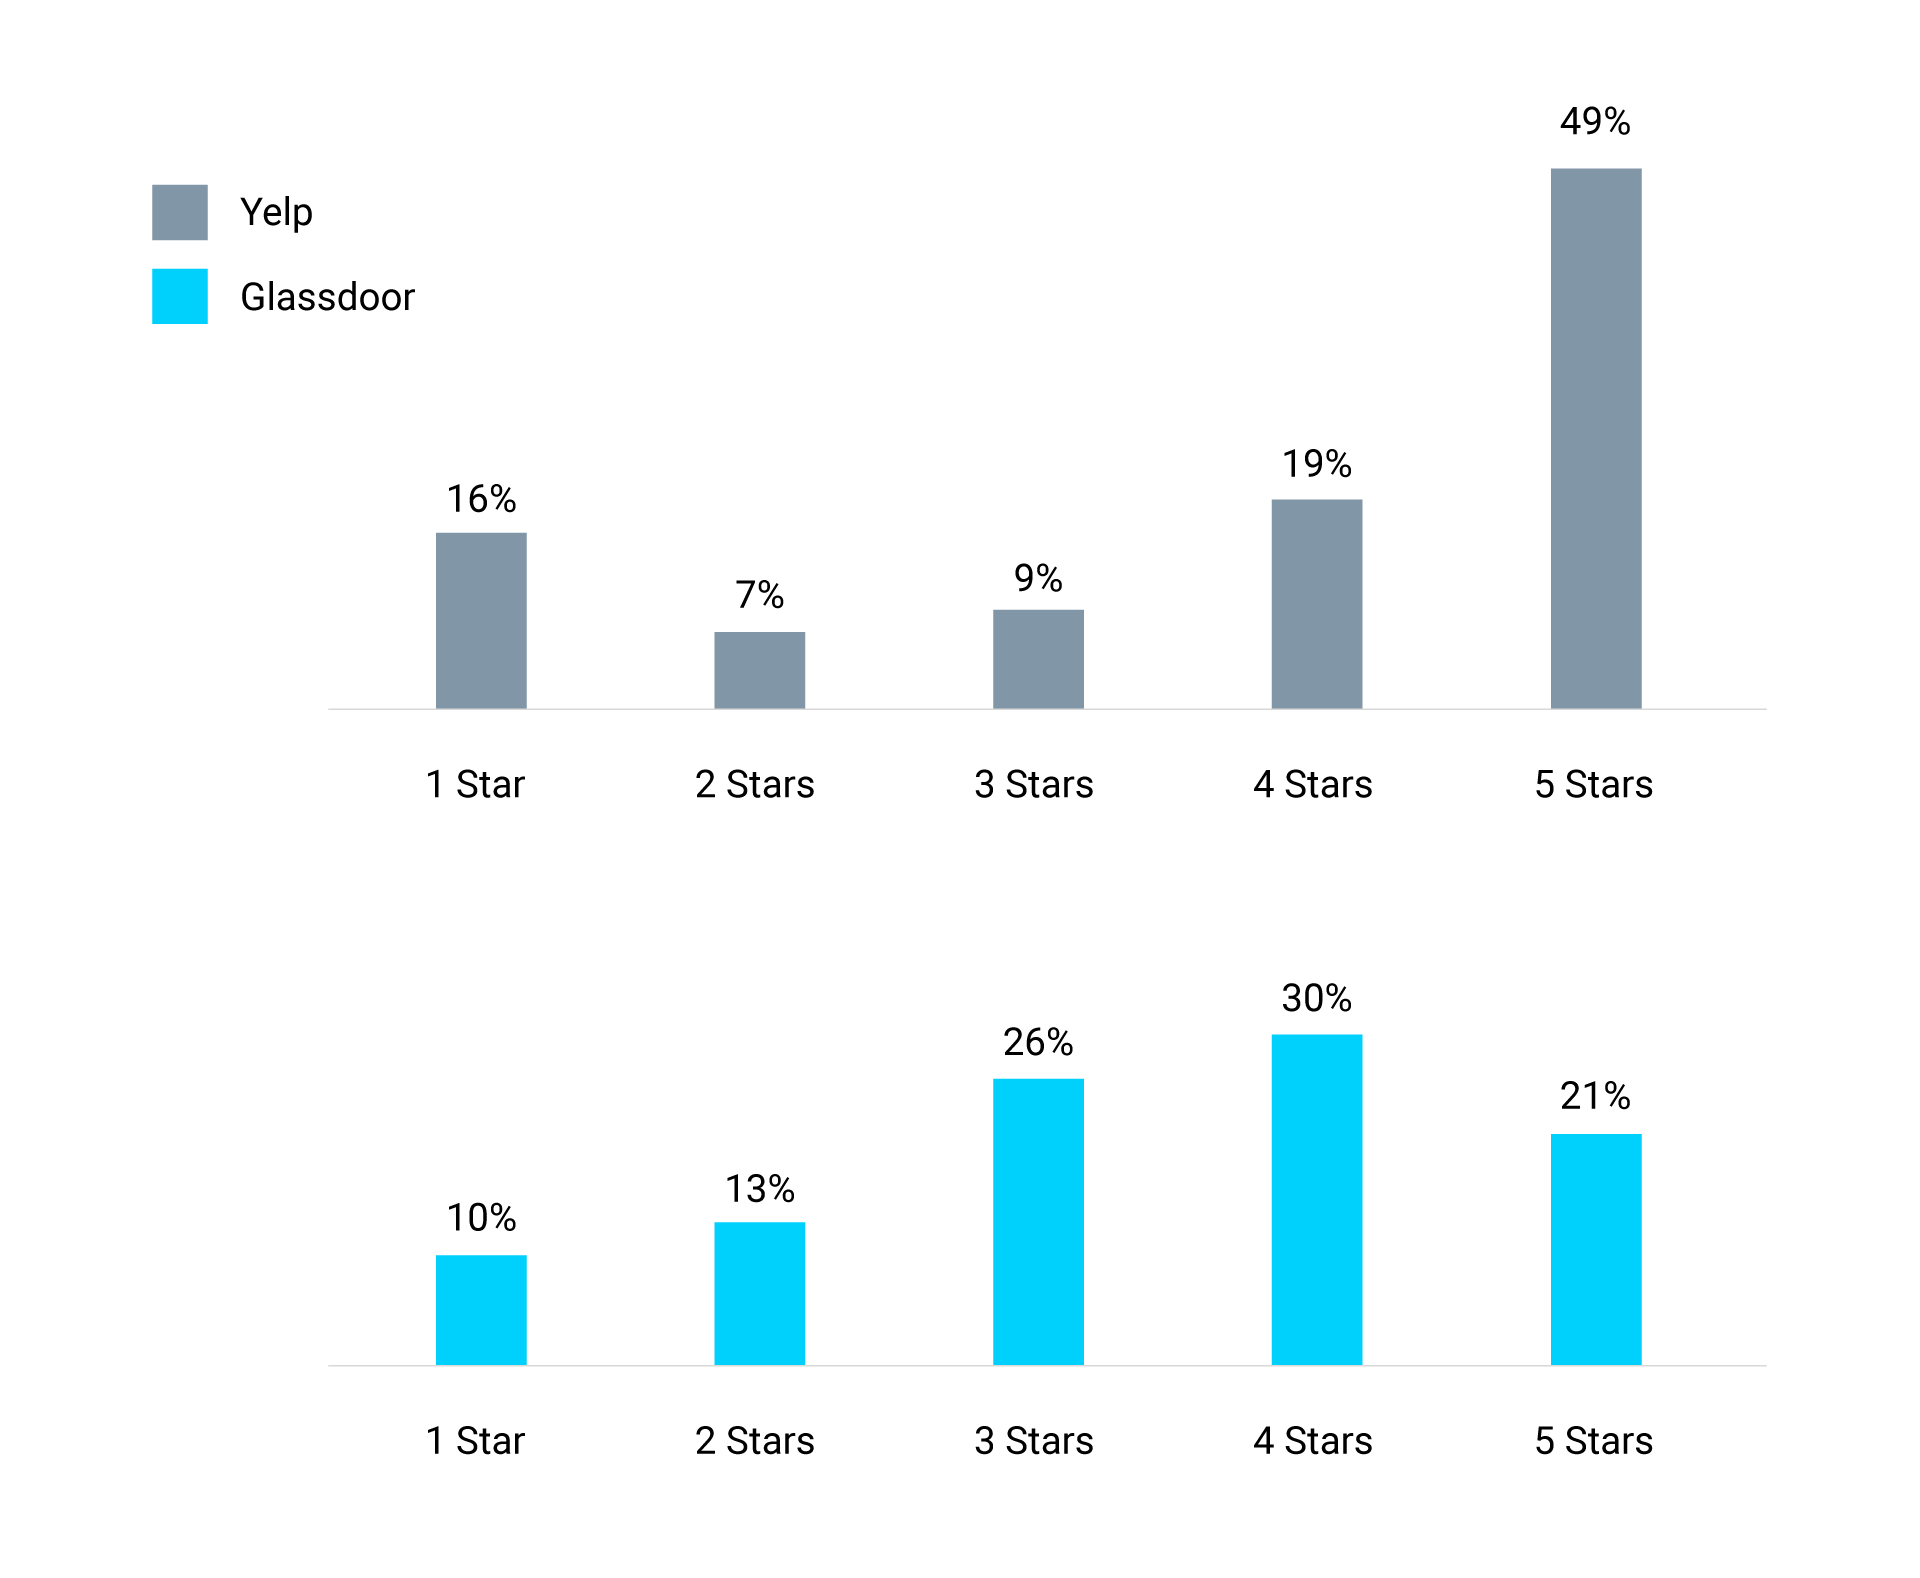
Unlike Yelp, Glassdoor reviews gravitate toward the center of the distribution with fewer extremely positive or negative ratings. (See “Yelp Versus Glassdoor Reviews.”)21 A recent study compared the polarization of reviews across online rating platforms based on the percentage of extreme reviews.22 Of the 25 online platforms analyzed, 21 were more polarized than Glassdoor.
Glassdoor minimizes polarization through a series of policies designed to promote honest and representative reviews. Employees, for example, can post no more than one review per company per year. This prevents vocal workers from stuffing the ballot box. Glassdoor has also minimized polarization with its “give to get” policy, which requires users to leave a review in order to access content on the website.
Reviews might also not present an accurate picture of organizational culture if companies incentivize or pressure employees to write glowing evaluations. Glassdoor has explicit community standards that prohibit companies from coercing, coaching, or incentivizing positive reviews. The company uses algorithms to detect content that might violate community standards, and users can flag questionable content. Glassdoor moderators review all flagged content and reject approximately 10% of submitted reviews deemed to violate community standards. There are also consequences for companies that try to cheat — employers caught violating community standards can be banned from consideration for Glassdoor’s Best Places to Work list and other awards.
We would expect to see large spikes in the number of positive reviews if companies were trying to incentivize reviews, but not all spikes indicate a company is gaming the system. Several factors can account for a surge in the number of reviews a company receives in a month. Some spikes occur purely by chance.23 News events — positive or negative — can also cause spikes. Intel, for example, experienced an upsurge in the number of reviews after announcing it would exit the smartphone chip market and lay off 12,000 employees.24 Companies can also ask employees to write honest reviews without attempting to influence the content. Increasing the number of reviews without skewing their distribution is good news since it provides us with more data to analyze.
To detect potentially problematic reviews, we identified months for companies that saw two or more standard deviations above the monthly mean for the number of reviews and the overall rating for the company, which we call positive spikes. Positive spikes were exceedingly rare — accounting for 0.1% of the company months in our sample. Nor do all positive spike months result from companies violating community standards. Some positive spikes happen by chance and others could be triggered by positive news. To be on the safe side, however, we dropped all positive spike months from our sample. When the positive spikes were removed, the remaining months with a large number of reviews were indistinguishable from our full sample.25
Codifying Culture With Machine Learning and Human Expertise
When describing culture, Glassdoor reviewers deploy rich and varied language — full of slang, idioms, acronyms, buzzwords, and colorful phrases. Nearly 80,000 employees discussed integrity in their reviews, for example, but less than 5,000 mentioned that specific word. Instead, employees used hundreds of synonyms and antonyms (ethics, deceit, amoral), idioms (sweep under the rug, cut corners), and slang (shady, shenanigans). Their language paints a nuanced picture of corporate culture but also defies simplistic approaches to textual analysis.
We initially analyzed the Glassdoor data with standard natural language processing tools, but the results were disappointing.26 To accurately classify text into topics that matter to managers and researchers, we built a custom dictionary from the ground up by combining machine learning tools and human expertise. This approach dramatically improved the accuracy of our models.27
To create a customized machine learning dictionary, we began by selecting topics that companies frequently included in their corporate values or that had been researched extensively. We then constructed a preliminary dictionary of high-fidelity words or phrases for each topic, and two of our research team members analyzed a random sample of at least 20 reviews that included each term. Terms that were at least 90% accurate were included in the dictionary for a topic. Ethical, for example, was a first ballot shoo-in for the integrity dictionary. If a word or phrase was less than 30% accurate, we dropped it. Terms that fell in between were fine-tuned until they could be included in the dictionary or dropped. This bootstrapping approach produced tens of thousands of terms, which human experts reviewed and refined.
To improve the accuracy of our results, we specified the sequence of words in a phrase — backdating has a very different meaning than dating back — as well as the distance between the words. Rather than applying a one-size-fits-all approach to handling close variants of a word, we differentiated between different uses. Employees, for example, typically use the word management to describe top leaders, manager when talking about their own boss, and manage to describe, for example, how they manage to get their work done despite distractions. We also identified words that meant a reviewer was not talking about a specific topic. The word vision typically refers to a company’s strategy, unless it appears in a sentence with dental, pension, or 401(k), in which case it describes a company’s benefits package.
For each term, we specified its component words, close variants, sequence and distance between words in a phrase, exclusion terms, and common misspellings. We also incorporated company-specific language. In most companies, for example, a shopper is a customer, but in Instacart a shopper is a worker. We reviewed the refined terms in context and also tested their fit with a topic by using a variety of algorithmic tools. This painstaking process took three years and produced a dictionary consisting of over 20,000 highly accurate terms mapping to more than 90 topics.
Exploring the Culture 500 Companies
The average company in our sample has over 2,000 employee reviews — the equivalent of three full-length books’ worth of textual data.28 Nearly all of the organizations in the Culture 500 are for-profit companies, and most are headquartered in the U.S. (We have included some international companies with large numbers of employees based in the U.S.) Regardless of where the company is headquartered, we included reviews only from employees based in the U.S.
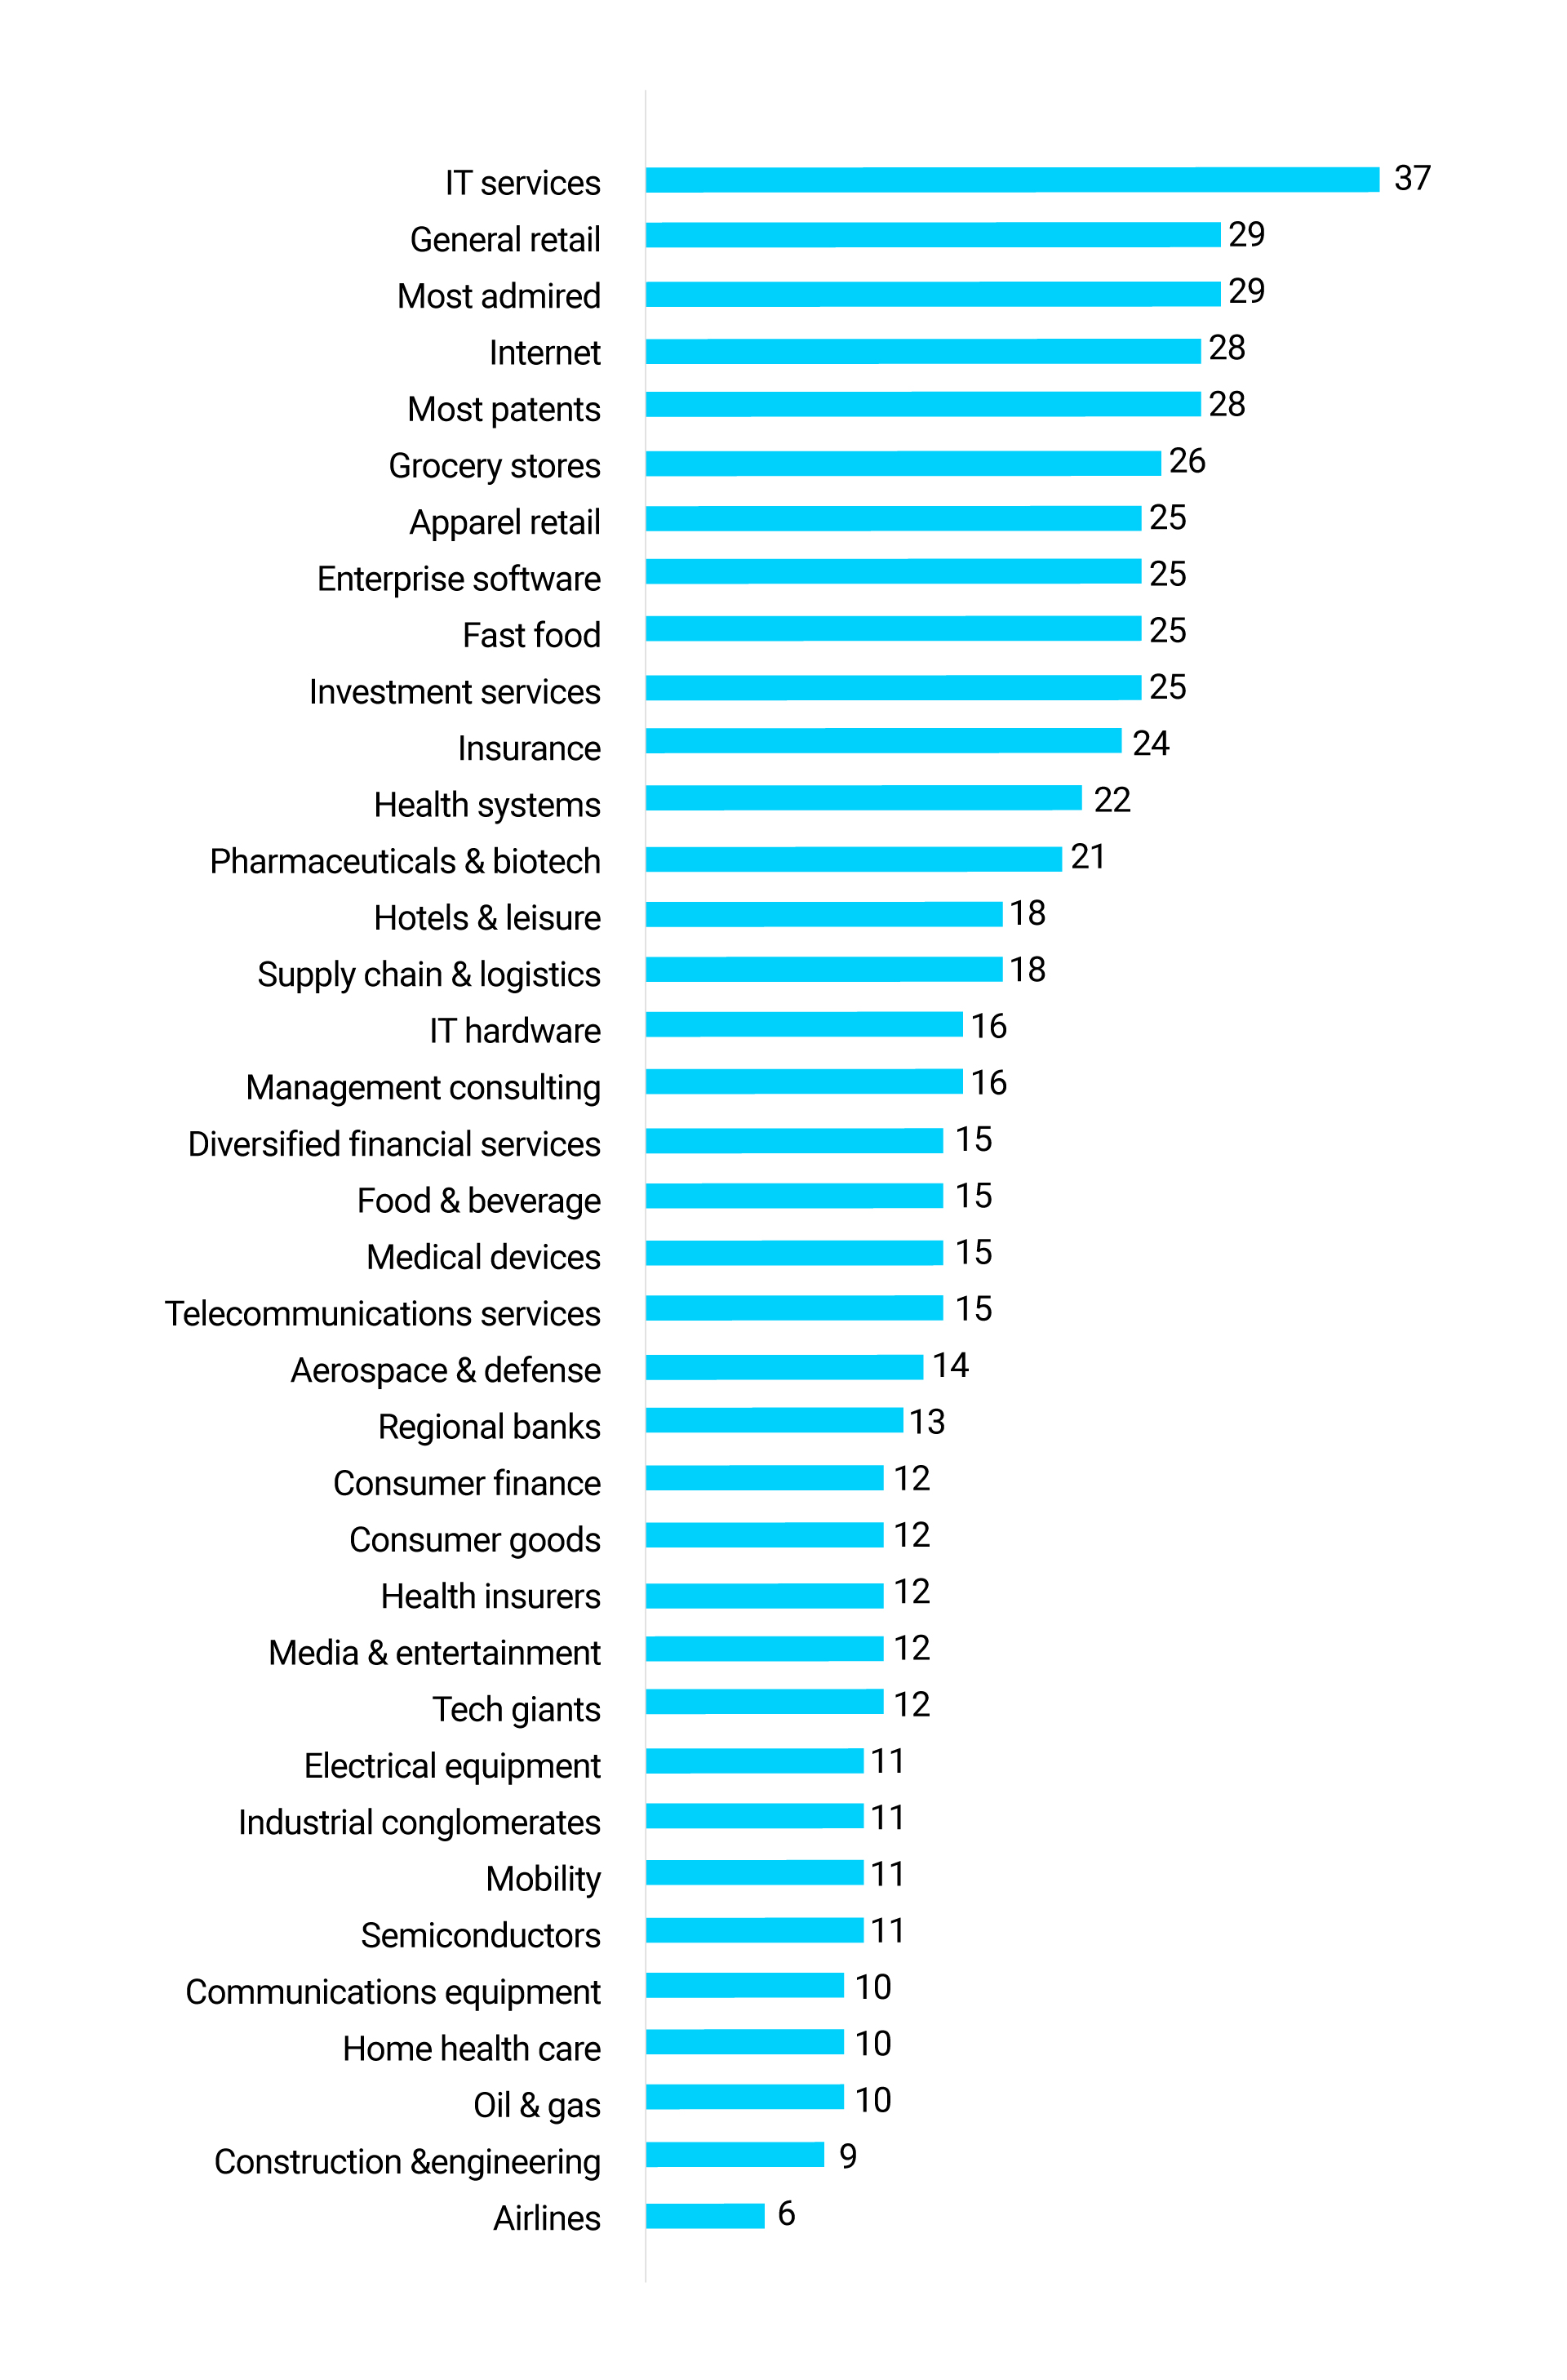
Companies in the Culture 500 are divided into 33 clearly defined industries, with an average of 18 companies per industry.29 (See “Overview of Culture 500 Industries.”) Organizing companies into industries with at least 10 competitors allows for meaningful comparisons of corporate culture. It is not particularly useful to compare Amazon to Five Guys Burgers or Tim Hortons on innovation, but benchmarking Amazon against Facebook, Alphabet, Apple, and Netflix provides real insight. Companies that compete in multiple industries — Johnson & Johnson, for example, makes medical devices, drugs, and consumer goods — are included in more than one industry. We also include lists that cut across industries, like companies with the most patents and the most-admired companies.30
Overview of Culture 500 Industries
The Culture 500 represents 33 industries with an average of 18 companies within each industry. The number to the right of each bar graph denotes the number of companies included in that industry.
How Leaders Can Use the Culture 500
The Culture 500 provides a data-based view of the corporate cultures of some of the largest and most powerful organizations in the world. Leaders of these companies can benchmark their organizations against direct competitors and also best-in-class corporations that excel, for example, in the kind of agility, innovation, and customer orientation required to thrive in dynamic markets. Corporate leaders can also gauge whether employees believe they are living up to their stated values by, for instance, respecting every worker, acting with integrity, and providing an inclusive environment for a diverse workforce. Armed with these insights, executives can highlight cultural strengths to incorporate into their employer brand, spot warning signals for potential problems, and identify opportunities to improve their culture. They can also analyze acquisition and partnership candidates to identify cultural mismatches that could derail deals.
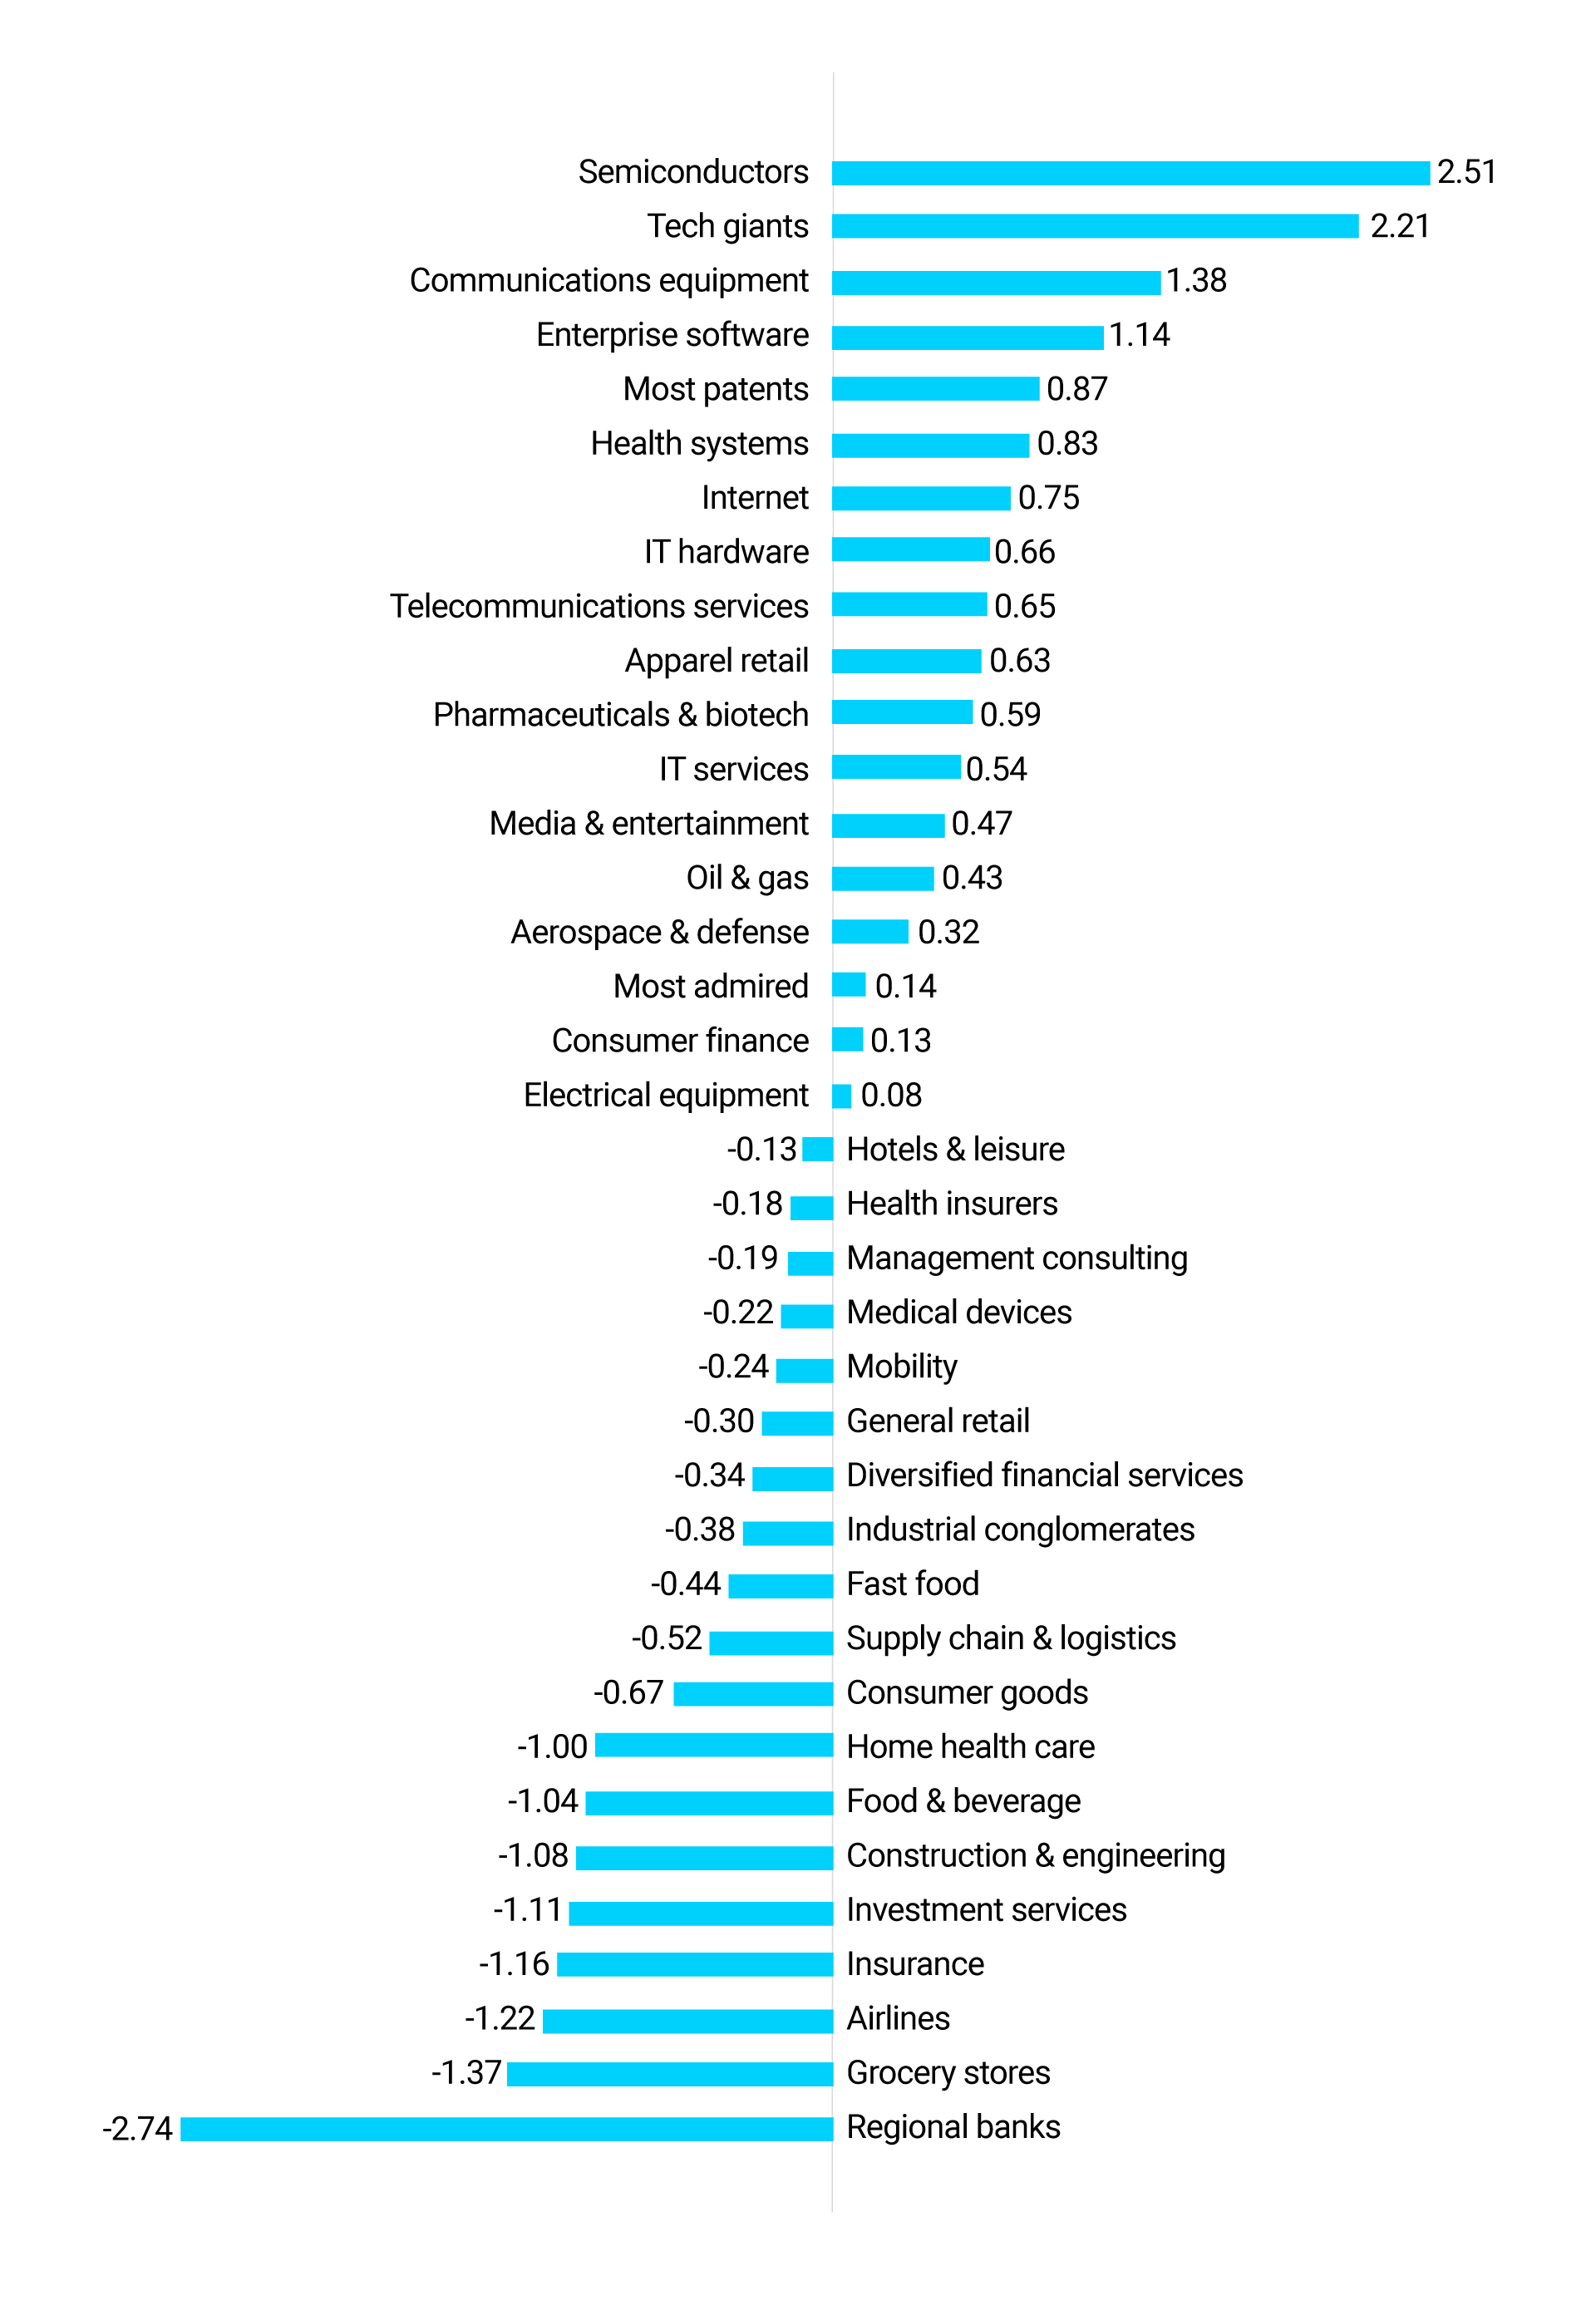
Entrepreneurs, likewise, can use the Culture 500 to assess the cultural fit between their startup and a large corporation before entering into a partnership or being acquired. They can identify companies or industries that struggle with innovation or customer orientation that could be targets for disruption. (See “Innovation Sentiment by Industry in the Culture 500,” which ranks industries in terms of employees’ assessment of innovation. It shows how employee reviews can predict industry changes, such as fintech startups’ disruption of financial services — including regional banks, insurance, and investment services industries.)
Innovation Sentiment by Industry in the Culture 500
This chart shows which industry’s employees rate innovation most favorably within Glassdoor reviews. This chart is based on over 1.2 million reviews. The numbers denote the number of standard deviations above or below the mean sentiment score across all industries.
Corporate culture matters beyond its power to drive financial results. The average employee spends 40% of her waking hours at work. A vibrant culture can help people thrive professionally, enjoy their job, and find meaning in their work. A toxic culture, in contrast, can be soul destroying. Large corporations are arguably the most powerful players in the global economy. By committing to values like diversity, integrity, and respect, influential companies can raise the bar of what is possible and desirable for competitors, suppliers, partners, and startups. Organizations that compromise their values breed cynicism and undermine the norms required for society as a whole to flourish. The Culture 500 celebrates excellence in culture, rewarding it with public recognition, and spurring it forward by identifying areas where some of the world’s most influential companies can improve their culture.
About the Partners
MIT Sloan Management Review
MIT Sloan Management Review leads the discourse among academic researchers, business executives, and other influential thought leaders about advances in management practice that are transforming how people lead and innovate. MIT SMR disseminates new management research and innovative ideas so that thoughtful executives can capitalize on the opportunities generated by rapid organizational, technological, and societal change.
Glassdoor
Glassdoor combines all the latest jobs with millions of reviews and insights to make it easy for people to find a job that is uniquely right for them. The company is on a mission to help people everywhere find a job and company they love. In pursuit of the mission, Glassdoor helps employers hire truly informed candidates at scale through effective recruiting solutions like job advertising and employer branding products. Launched in 2008, Glassdoor now has reviews and insights for approximately 900,000 companies located in more than 190 countries.
CultureX
CultureX delivers actionable insights organizations need to measurably improve their cultures. Harnessing cutting-edge artificial intelligence developed at MIT, CultureX measures culture with high accuracy and pinpoints concrete ways to improve. Based on decades of research and work with dozens of Fortune Global 500 companies, CultureX provides evidence-based interventions tailored to the client’s unique needs. CultureX builds vibrant cultures to enrich the lives of employees and win in the marketplace.
Comments (4)
Gaurav Pandit
Louis Wong
Louis Wong
Rebecca Casey