Which Innovation Efforts Will Pay?
For many companies, developing new products is a hit-or-miss proposition. Some businesses with successful innovation practices are relying on a new analytic tool to ensure that the hits are much more likely.
Topics

Courtesy of Volkswagen
Successful innovation — the kind that leads to customer engagement and profits — is rare and hard to achieve, or so one might conclude from observing the results of many companies’ innovation efforts. Some have tried investing intensively in research and development. But a recent Booz & Co. study of public companies representing almost 60% of global R&D expenditures found that above a certain minimal level, there is generally no correlation between R&D spending and financial metrics such as sales or profit growth.1 Some have tried to follow prevailing trends such as open innovation — but that, too, doesn’t necessarily lead to higher innovation returns.2 Many pursue a strategy of tacit benchmarking: They invest near the average amount of R&D spending for their industries, while running development shops that use many of their peers’ best practices. That approach, over time, has led to greater numbers of minor product line extensions with often diminishing returns.
Yet some companies seem to be better at dreaming up great new products while spending less to do it. Apple Inc. commits 5.9% of sales to R&D, less than its industry’s average of 7.6%. The R&D budgets for two of Detroit’s beleaguered Big Three have been consistently higher than that of Toyota Motor Corp., at least until 2008. Where innovation investment is concerned, the key question is not how much to spend but how to spend it.
Return on Innovation Investment
It’s easy to conclude from this track record that innovation success depends on mysterious factors, part science and part magic, rather than business acumen. But there are companies that overcome these hurdles and regularly produce high-yield innovations. Examples include companies as disparate as Cisco Systems, Tata Sons, Campbell’s Soup and Volkswagen. Because these companies (and other successful innovators) are so diverse and the factors that distinguish them have been obscure, my colleagues and I have looked for a reliable analytic tool that can help explain why some innovations succeed and others fail. We believe we have found one with the return on innovation investment or ROI2 methodology.
The ROI2 approach is based on a series of innovation studies conducted during the past seven years with companies in the consumer products, health care and chemical industries.3 ROI2 correlates directly with organic growth and links innovation spending with financial performance in ways that can lead decision makers to generate higher, more reliable returns on innovation and R&D.
In 2002, Pfizer Inc.’s Consumer Healthcare subgroup wrestled with innovation effectiveness and organic growth. Company leaders wondered whether there was a way to replace “going from the gut” with real science in managing innovation. The company (since acquired by Johnson & Johnson) was hindered by a new product development system that was long on process and short on results. The number of products Pfizer CHC managed to roll out each year was below the industry average, and its annual project cost was one of the highest. In an industrywide benchmarking study conducted by the company that year, its innovation performance was ranked below average among nine competitors. Following received wisdom, the managers invested based on industry norms, despite not knowing what level of innovation investment was required to meet their ambitious growth objectives. They knew that spending more on R&D hadn’t always yielded a payout in the past, so they wanted to invest more wisely. Yet they had no reliable way of evaluating different types of projects and determining which products in their development portfolio would be the most productive. The innovation portfolio was only vaguely guided by corporate strategy. Decisions on what to spend money on were based much more on guesswork than methodology.
The Leading Question
How can companies have a better sense — in advance — of which innovation efforts are most likely to pay off?
Findings
- Successful innovation comes from careful attention to a small number of important criteria. Don’t ask how much to spend, but how to spend.
- The “return on innovation investment” methodology correlates with organic growth and links innovation spending with financial performance.
- An “innovation effectiveness” curve lets companies plot innovation spending against the financial returns from those projects — and “solve for growth.”
None of this is unusual. But product development is not a business for those who are afraid to start over. The Pfizer CHC team posed a question that will be familiar to many organizations that are underwhelmed by their innovation performance but overwhelmed with advice on how to fix it: Where do we start?
The right answer, we believe, is with the ROI2 analysis. By breaking down the R&D process into its fundamental components, expressed as a set of simple key numbers, and placing those components in the context of a portfolio explicitly aligned with corporate strategy, ROI2 offers managers a way to increase returns without necessarily spending more money.
Analysis based on this metric (and on an innovation effectiveness curve that is derived from it) shows why many companies have not achieved their hoped-for results. When corporate leaders understand this, and when they see their R&D-related decisions and capabilities tracked in rigorous economic terms, they can see how they might improve their current innovation practices. They can more confidently expect to improve short-term innovation performance by reallocating resources and reach longer-term growth goals by building rigorous self-understanding and superior innovation capabilities.
The Innovation Effectiveness Curve
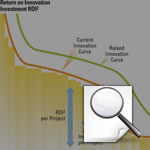
Imagine you are a manager faced with a budget cycle and an unwieldy portfolio of projects, each with a marketer or chemist attached who assures you this project is the greatest idea ever. The first step is understanding, and so to identify both short- and long-term improvement opportunities, a company needs to diagnose its innovation practices and capabilities. The diagnosis can be quite different from one company to the next, and that is one of the reasons why adopting industry benchmarks doesn’t work. The individual innovation profile represents the value and quality of a company’s innovation portfolio and can be clearly expressed as an “innovation effectiveness curve.” (See “Innovation Effectiveness Curve.”) The shape and height of this curve, not the total amount spent on R&D, reflect how much a company may ultimately expect to earn from its innovation investments and how much organic growth these investments will generate.
Innovation Effectiveness Curve
The innovation effectiveness curve can help companies track which
innovation projects are worth funding and which are likely to yield little.
To build the effectiveness curve, we plot annual spending on innovation projects against the financial returns from those projects, measured as a projected internal rate of return.4
This is done on a project-by-project basis, which means that the curve contains data about every active project in the pipeline for a given company. While each point on the curve represents return on innovation investment for a particular project (see “Innovation Effectiveness Curve”), the area under the curve represents the company’s total projected return on annual innovation investment. The height of this curve provides a definitive verdict on the power of the innovation capability to drive returns and generate growth. The higher the curve, the greater the overall returns on innovation investments.
The curve has three properties that make it a powerful analytical tool:
It is comprehensive. ROI2 provides a holistic view of R&D, marketing, strategy and operations — the activities directly bearing upon the creation and launch of new products. Most corporations silo these activities and evaluate them separately, against different goals.5 The effectiveness curve rolls into one all functions that bear on new products.
It is stable. For the companies studied, the effectiveness curve has remained remarkably consistent over time. Even when projects in the innovation pipeline changed, the overall shape of the curve remained the same, unless a company significantly changed its innovation strategy and capability.
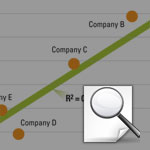
It correlates with growth. Until now, the precise nature of the relationship between growth and R&D investments has puzzled practitioners and largely been unproven. The curve demonstrates a connection between the effectiveness of innovation efforts and the growth of the company. (“Total Return on Innovation Investment vs. Revenue Growth” shows the correlation between ROI2 and organic growth for consumer health care companies.)
Total Return on Innovation Investment vs. Revenue Growth
Growth of these health care companies is not correlated with innovation so much as it is correlated with the effectiveness of the innovation.
On one level, the relationship between ROI2 and organic growth rates makes it a metric to track over time; when a company’s innovation effectiveness falters, that is a signal that growth may slow as well. A more directly practical value lies in letting R&D and marketing organizations rethink how they create and launch products. Beyond the ROI2 metric serving as an indicator and a rapid diagnostic, it lets companies “solve for growth” by analytically designing an innovation pipeline to achieve specific growth objectives. By making measurable improvements to any of the components of ROI2, a company can increase the area under the curve and therefore its organic growth. Knowing the relationship between ROI2 and organic revenue growth allows a company to maximize the incremental growth rate that can be achieved by tuning up its innovation engine.
When corporate leaders look at their own effectiveness curve, they usually find room for improvement. Some supposedly active projects, they learn, haven’t been touched in years. Others turn out to have only one single, vocal champion. Since the curve itself is a summary view of a number of different projects, examining it yields insights into the innovation organization and the portfolio as a whole.6
Most effectiveness curves consist of three visually distinct sections:
“Hits” — A handful of high-return projects that usually cannot be consistently replicated. These could be visible endeavors with broad appeal or smaller, less expensive changes to an existing product that significantly improve its functionality or convenience.
“Healthy Innovation” — The middle region of solid projects, which provide the bulk of returns on innovation. These are the modest but nonetheless respectable “base hits” that form the bulk of most companies’ product and service portfolios.
“The Tail” — The low- to no-return stragglers that probably shouldn’t remain in the portfolio.
Most curves we have seen display clear dividing lines among the sections: a few obvious winners, a separate but larger cluster of “healthy innovations” and a too-long tail. The number of companies with a long innovation “tail” reflects the natural tendency to put more money into new product development pipelines than those pipelines can efficiently spend.
Moreover, the curve remains unchanged in many companies even when leaders try to improve their innovation performance. For example, increases in R&D spending alone not only fail to raise returns on investment but often drive them down. These corporations end up spending beyond their point of minimum returns, throwing good money away on more marginal projects, usually without knowing that they are doing so. In such cases, further increases in R&D expenditures only extend the tail portion of the effectiveness curve, the portion without significant returns.
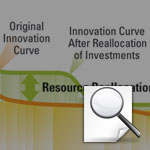
Businesses can change the curve. One company that was able to make significant short-term improvement in its innovation effectiveness was Bayer MaterialScience AG, a subsidiary of Bayer AG that produces polymers used in high-performance plastics, coatings and sealants. BMS’s effectiveness curve revealed a lengthy tail, which suggested an opportunity to redistribute resources. A closer look revealed a recurring characteristic of the lower-performing projects: They tended to target a different customer segment and be in a different product category than projects higher up the curve. Understanding which customer segments and categories generate higher innovation returns let BMS reprioritize new product initiatives and redeploy resources in R&D, sales and marketing into projects supporting these higher-return markets, customers and categories. Customer groups that placed more value on BMS’s innovation products were identified, and new projects were targeted for them. The result was that BMS increased its ROI2 by 14% and by the end of 2007 accelerated its organic growth rate from 3% to 4%.
“Improving the Effectiveness Curve” (p. 57) shows the original and improved effectiveness curve for BMS before and after the reallocation.
Portfolio realignment can yield strong results — BMS saw action within a year — but more important than cost cutting is raising the effectiveness curve itself. Raising the curve requires a more granular understanding of the company’s overall profile so that it’s clear which innovation capabilities need investment.
Using the Effectiveness Curve to Identify Longer-Term Opportunities
Six distinct innovation key performance indicators or KPIs can be derived from the effectiveness curve. They provide a diagnostic tool that can tease apart the components of the company’s innovation capability. These KPIs are:
- Average internal rate of return for innovation projects, weighted by cost
- Total return on innovation investment per year
- Annual innovation investment
- Proportion of the portfolio made up of projects with lower returns (the “tail”)
- Ratio of growth to maintenance projects (projects designed to maintain share in a shifting market)
- Average projected revenue of “big idea” projects (those with higher risk/reward)
By using the curve to diagnose companies according to their key innovation metrics, one can see more clearly where adjustments must be made. If a company wants to raise the growth rate of its core offerings or adjacencies, the KPIs tell it how plentiful, daring or wide-ranging its innovation efforts must be. A company can then alter its profile and escape the constraints of the past.
The KPIs also reveal patterns of over- or underperformance. For example, an organization identified as having a healthy ratio of incremental innovations to growth-oriented innovations projects — a ratio that should, according to past experience, produce a strong growth rate — might fail to produce that rate because it is investing too little in both types of projects. Another might have an ample innovation budget but might be placing bets on only a few ambitious projects, exposing itself to unnecessary risk.
For companies like Bayer MaterialScience, understanding these next-order metrics provides a more precise view of the drivers of innovation effectiveness. For example, by examining the proportionality metric, BMS executives understood the extent to which resources were being used on “tail” projects. And by reevaluating its ROI2 under different assumptions about revenues and market conditions, the company was able to understand how a successful reallocation of resources into higher-value projects would increase growth.
Improving the Effectiveness Curve
Bayer MaterialScience reallocated what it was spending on various
innovation initiatives and saw cost savings emerge from knowing which of them were more likely to garner customer approval.
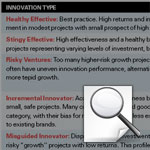
In a similar way, the effectiveness curve allows a company to build a profile of its current innovation approach, as well as a regimen of potential new innovation capabilities for its particular profile that can improve longer-term performance. That is possible because, in compiling the KPIs for a number of different companies, seven distinct recurring patterns emerged. There appear to be seven clear archetypes that characterize common groupings among the KPI drivers. While every company is unique, knowing its general type can indicate potential approaches for improvement. (See “The Seven Types of Innovators.”)
A company’s placement in one of these categories represents an overall judgment about its innovation projects. Businesses must identify the root causes of their recurring problems. Bayer Healthcare AG’s Consumer Care Division, another segment of Bayer AG, was a classic incremental innovator. In 2001, its brands were household names, but it had a pipeline filled with small “base hits” that were launched rapidly to a minor market reaction. The organization was efficient but risk averse.
After understanding that its current capability could not meet its growth goals, the company decided to explore larger and higher-risk ideas in several consumer health care categories. While not all of these bigger bets were successful, Bayer Consumer Care raised its overall innovation return and accelerated its growth rate.
The Real Relationship of R&D and Strategy
Evaluating innovation metrics and types inevitably leads to a new view of R&D’s relationship to corporate strategy. The KPIs describe symptoms, but they are not root causes. The symptoms are themselves driven by a combination of the company’s innovation capability and its strategy.
Companies can improve their innovation performance by rethinking their strategic choices, guided by an understanding of the components of ROI2. For example, a company with a first-mover strategy might reinvent itself as a fast follower by replacing a few risky projects with a handful of more modest, safer alternatives. Coca-Cola Bottling Co. Consolidated took this approach after the failure of New Coke in the 1980s, and more recently Hyundai Corp. and Verizon Communications Inc. have similarly proven to be successful at me-too-ism.
The Seven Types of Innovators
Each category has its own profile, based on scores of innovation effectiveness — the combination of seven key performance indicators.
A company’s analysis of the effectiveness curve can reveal important differences between the strategies that lead to healthy innovations and those that fall into the tail. These differences might be driven by the approach to innovation just mentioned (first movers vs. fast followers); by product categories; by targeted customer segments; by the genre of innovation (formulation vs. packaging); by a specific trend imperative (convenience innovation vs. taste); or by the presence of a new technology. Once the differences are determined and understood, a company can adjust its strategic innovation priorities by shifting investment into areas with greater returns. As the example of Bayer MaterialScience showed, this approach to revamping the innovation strategy can yield results within a few development cycles.
An even more powerful use of the tool is to drive sustainably higher returns on investment. Pfizer CHC was able to use its effectiveness curve and next-order metrics to develop the innovation capabilities required for success and revamp its innovation organization. As noted earlier, in 2002 the company was struggling to find an approach to a sluggish new product pipeline and an arthritic development process. Having defined some of its fundamental challenges, Pfizer CHC saw that it was falling into the category of misguided innovator, with a significant number of high-cost, risky projects with disappointing returns.
Guided by specific KPIs, the company focused on redefining its innovation strategy and significantly improving one of the most critical innovation capabilities: effective new product portfolio management. These efforts resulted in improved decision-making discipline, substantial reduction in time to market and a lower average project cost. The company kept the innovation pipeline full of fresh ideas closely linked to the overall growth strategy. Within a year, the number of new initiatives more than doubled, from 20 to 45. Meanwhile, 22 projects that did not meet decision criteria in the stage-gate process were killed. In the past, projects had very rarely been canceled; they limped along for years, consuming scarce resources.
The results of Pfizer CHC’s innovation overhaul were striking. Over the relatively short period from 2003 to 2005, average time to market decreased from 39 months to 24 months, while the return from new initiatives increased by more than 50%.
Ultimately, rigorous analysis of the innovation capability can allow almost any company to “solve for growth.” Understanding the effectiveness curve and innovation type lets an organization start with the low hanging fruit, reallocating resources that are underperforming to areas that have more potential. Longer-term results require a more thorough understanding and reworking of the areas of innovation capability that are holding the organization back.
The Top Habits of Highly Effective Innovators
Although every organization has its own challenges, the research on ROI2 has uncovered some patterns of behavior among the top innovators that qualify as best practices. To start, the best innovators had a clear, well-defined strategy, a set of performance metrics and goals. They also had a clear cross-functional process with specific steps and transparent decision criteria. Many corporations that did not make this group had decision-making standards and governance procedures that could charitably be described as ad hoc.
We pulled together those internal disciplines that most effective innovation organizations had in common and that the ROI2 approach tends to improve. Consider them the top habits of highly effective innovators:
Align Growth and Innovation Strategy — The best companies aligned their innovation strategy with their corporate strategy.7 For example, in consumer health care, a high performer would have a significant number of projects against specific disease states or categories that were corporate priorities. We found that focusing on growth imperatives and investing in innovative products did tend to increase ROI2, but only if those investments were made in categories that were of explicit strategic importance to the company. Higher-risk projects that fell outside of priority areas tended to diminish returns. We also learned that leading innovators simultaneously pursued several alternative growth platforms.
Practice Portfolio Management — Portfolio management is a cross-functional capability that enables a holistic view of the entire project portfolio, with an emphasis on selection criteria, assessment, decision making and governance, as well as the balance among projects. The better-performing portfolios tended to have a balance of projects across multiple criteria, among them size, segment, category, launch time and risk. Worse performers were less likely to include resource constraints among their evaluation considerations, alongside net present value, strategic fit and balance.
Keep Managing After a Project Enters the Pipeline — Good innovators are voracious consumers of ideas: They take ideas from anywhere and everywhere. The most effective companies let more ideas into the pipeline at the beginning and have a higher proportion of their total portfolio in the predevelopment stage. However, when it came time for significant investment, best-in-class innovators did some ruthless pruning and advanced fewer projects to the later stages. Because they had fewer costly later-stage ideas in their pipelines that didn’t work out, better innovators also had a faster average time to market.
Let the Market Help You Innovate — Successful innovators often allow more products to be launched and tested by the market. Traditional market research is often not a good predictor of success. Excessive focus on market research can increase time to market and lead to unnecessarily small and incremental innovations. Some successful innovators launch a greater number of new products and let the marketplace and consumers dictate the portfolio of winners and losers. This strategy relies on effectively evaluating the early market response to a new product launch with the intent of quickly killing bad ideas and amplifying the impact of successful ones.
Insist on Organizational Discipline — Finally, the best performers had a healthy organizational and process discipline. In line with defined strategies and evaluation criteria, they took the “pet project syndrome” out of the equation. They tended to have dispassionate new product portfolio management that was not controlled by any single function.
Energizing any important internal capability is almost never quick or easy. But in the case of innovation, it is an effort well worth making. As we saw in the case of both Pfizer and Bayer, making systemic improvements in innovation capability truly raises the curve, resulting in an increase in organic growth rates that can be persistent over time.
References
1. B. Jaruzelski, K. Dehoff and R. Bordia, “Money Isn’t Everything: The Global Innovation 1000,” Strategy + Business (winter 2005). Also see G. McWilliams, “In R&D, Brains Beat Spending in Boosting Profits,” Wall Street Journal, Oct. 11, 2005, sec. A, pp. 2, 13: “The finding flies in the face of academic studies and accepted wisdom on the value of corporate research.”
2. See R.M. Kanter, “Innovation: The Classic Traps,” Harvard Business Review 84 (November 2006): 73-83. Kanter writes, “Too often … grand declarations about innovation are followed by mediocre execution that produces anemic results.” A similar point is made in T. A. Stewart, “The Great Wheel of Innovation,” Harvard Business Review 84 (November 2006): 14: “Companies have been rushing to find new ways to make old mistakes.” (Approximately the same number of scholarly articles with “innovation” in the title were published in 2007 as during the entire decade of the 1980s.)
3. The concept of ROI2 and the effectiveness curve came out of two comprehensive studies of the consumer health care industry conducted by Booz & Co. in 2002 and 2006. All but one of the major companies in the industry agreed to participate in the process in exchange for a detailed readout of the results. The first step was a comprehensive questionnaire that asked for specific metrics on companies’ product portfolios, including numbers of projects, types, time to market, level of investment, resources required, projected sales and so on. Each company then submitted to a series of in-depth interviews with key personnel in the R&D and marketing organizations, where we probed into areas of corporate strategy and decision making. Additional information about portfolio management and best practices was gathered during subsequent engagements with two of the participants.
4. The ROI2 concept is based on the analysis of innovation portfolio. Given that the projects in the portfolio have not been launched, the projected IRR is the only measure of return available. We found that many, even early-stage, projects have relatively poor projected returns. The IRR data and the effectiveness curve built based in these data establish a pattern — an innovation “footprint” of a company — that tends to be very stable unless strategy changes.
5. A well-known exception is Procter & Gamble Co., where CEO Alan Lafley has committed to realizing 20%-30% of revenues from new products. See S.D. Anthony and C.M. Christensen, “Disruption, One Step at a Time,” Forbes, Oct. 27, 2008, 97-102.
6. For a discussion of the importance of focusing on the innovation process as a whole rather than in discrete pieces, see L. Fleming, “Breakthroughs and the ‘Long Tail’ of Innovation,” MIT Sloan Management Review 49, no. 1 (fall 2007): 69-74.
7. This was also a finding of the Booz & Co. Global Innovation 1000 study cited above.

Comments (3)
ghocker
Anonymous
navindu