A CEO Survey of U.S. Companies’ Time Horizons and Hurdle Rates
The competitiveness of U.S. corporations, particularly manufacturing firms, declined during the 1980s. The decade witnessed serious inroads by foreign firms into traditional domestic markets. In capital goods, for example, the import penetration ratio rose from less than 15 percent to nearly 40 percent. Some indicators of U.S. competitiveness have stabilized or shown some improvement in the first half of the 1990s, largely as a result of exchange rate movements and a strong U.S. macroeconomy. However, the productivity of foreign manufacturers, notably those in Japan, has grown faster than that of U.S. firms for more than two decades.1 This trend suggests that foreign corporations will continue to present stiff challenges to U.S. firms in the years ahead.
Many explanations have been advanced for the decline in U.S. industrial competitiveness during the 1980s. They frequently assign a central role to differences in the willingness of U.S. and foreign firms to forgo short-term returns in favor of long-term rewards. These differences in “time horizons” can manifest themselves in differences in R&D, plant, and equipment investment; training for workers with firm-specific skills; and willingness to undertake long-term market development programs. The interest in corporate time horizons has generated a lively academic and policy debate about the cost of capital facing firms in different nations. The cost of capital is an important component of the discount rate used in evaluating long-term projects and is increasingly viewed as a source of competitive advantage or disadvantage in world markets.2
Although the time horizons of U.S. firms have been implicitly at issue throughout the debates on competitiveness policy, there is little direct evidence on corporate planning horizons or on their changes during the 1980s.3 In this study, we attempt to bridge the gap between analytical studies of corporate capital budgeting and the policy debate on corporate competitiveness.
To investigate corporate time horizons and hurdle rates, we surveyed the CEOs of all firms in the Fortune 1,000. We asked them to describe their capital budgeting practices, provide information about hurdle rates and other determinants of their firms’ time horizons, and evaluate the effects of a number of different policies on their firms’ investment planning horizons. Here we report our survey findings, which focus on hurdle rates, the capital budgeting process, and the effects of various factors on investment in R&D and physical assets.
First, we describe the survey and summarize information on the firms whose CEOs responded. Next we analyze the responses on current discount rates and other indicators of corporate time horizons and compare the situation at the end of the 1980s with previous years. In the third section, we investigate the relative time horizons of U.S. and foreign firms, providing clear evidence that U.S. CEOs view their companies as more shortsighted than their foreign competitors. The small sample of foreign CEOs we surveyed shares this opinion. Finally, we evaluate the CEOs’ responses to the effects of hypothetical changes in the economic and policy environment, including taxes, corporate control regulations, interest rates, and stock prices, on their firms’ time horizons.
The Survey Design
In the fall of 1990, we mailed a four-page questionnaire to Fortune 1,000 firms with a cover letter from John Young, chairman of Hewlett-Packard and the Council on Competitiveness, and Dean John MacArthur of the Harvard Business School.4 Four months after the initial mailing, we sent a follow-up questionnaire and cover letter to firms that had not responded.5 The questionnaire consisted primarily of multiple choice and fill-in-the-blank questions but also allowed CEOs to write essays. Few chose to do so, so our analysis focuses on the structured questions.
Of 263 responses, thirty-five indicated that the firm does not answer surveys. Four surveys were returned as undeliverable. We received 228 surveys with responses to some questions, and most were quite complete. Unfortunately, sixty-eight CEOs who returned surveys did not identify their firms, so we could only match data on operating and financial characteristics to respondents for 160 surveys. We nevertheless include the unidentified responses in our overall tabulations of survey responses. Difficulty in finding some characteristics of certain firms that we could identify limited our data yield even further.
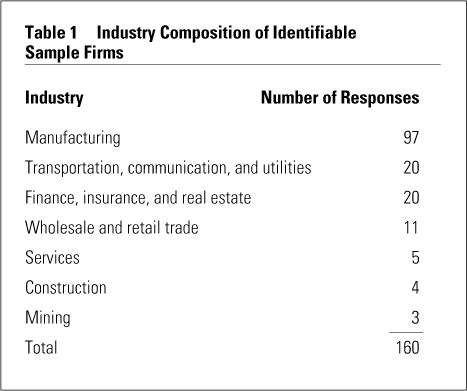
The Fortune 1,000 includes industrial and other companies. Because most international trade involves manufactured goods, many discussions of competitiveness focus on manufacturing firms. Table 1 shows the industry mix of responding firms. We received ninety-seven identifiable responses from manufacturing companies. In our analysis, we present results for three sets of firms: all respondents, all nonfinancial firms, and all manufacturing firms.
The low response rate calls for caution in interpreting the findings. One dangerous type of bias, which we have no way to evaluate, is the possibility that CEOs who are particularly concerned about shortsightedness in U.S. companies were more likely to return the questionnaires. This bias could mean that our sample does not represent the corporate population at large. There is no way to judge this possible bias without further information on nonresponding firms.
Time Horizons and Discount Rates
Most CEOs indicated that hurdle rates play an important part in their firm’s capital budgeting process. The average response placed hurdle rates between “very” and “somewhat” important. Only 10.3 percent of manufacturers and 8.8 percent of all sample firms rated hurdle rates as unimportant. We found no strong correlations between firm characteristics, including financial structure as well as CEO background, and the importance of hurdle rates.
We asked CEOs what fractions of their firms’ R&D budgets were devoted to projects with no expected payoffs in the next five years. We allowed respondents to select from a range of intervals, such as 0 percent to 10 percent or 10 percent to 30 percent. To summarize these interval responses with means and similar measures, we assigned each interval’s midpoint to each response and calculated standard summary statistics. Table 2 shows the results of these calculations.
The mean share of R&D devoted to long-term projects was 21.1 percent. For manufacturers, the average fraction was 22.6 percent. (Figure 1 shows the distribution of responses to this question and displays considerable heterogeneity.) Less than half of respondents indicated a long-term R&D share between 10 percent and 30 percent, the interval that includes our estimate of the sample average value.
When we asked CEOs about the proportion of the R&D budget devoted to long-term projects ten years earlier, their average response was 18.6 percent (22 percent for manufacturing companies). These results do not suggest that corporate time horizons became shorter during the 1980s.
We asked CEOs to report their firms’ hurdle rates and whether the particular rate applied to nominal or constant-dollar cash flows. The question asked for the hurdle rate that the firm would use to discount after-tax earnings from a typical investment project in the firm’s largest division. Two-thirds, 66.2 percent, reported nominal values. We converted nominal to real rates by assuming a long-term expected inflation rate of 5 percent per year, which seems approximately consistent with prevailing wisdom at the time of the survey. This calculation yields an average real hurdle rate of 12.2 percent for the full sample and 11.6 percent for manufacturers.6
The real discount rate implied by the responses is well above the historical real return on either debt or equity in U.S. financial markets. Since the mid-1920s, the average annual real return on corporate bonds has been less than 2 percent, and that on corporate equities has been approximately 7 percent.7 The average real discount rate in our sample also exceeds most estimates of the pretax profit rate of U.S. nonfinancial firms.8 These disparities raise an important question about the link between the variables that financial economists focus on when measuring the cost of capital and actual corporate practices.
It is important to recognize that, while changes in the cost of capital and related factors that affect the attractiveness of long-term versus short-term investment will affect hurdle rates, these factors are not the only determinants of hurdle rates. Risk considerations also affect the cost of capital, and one factor that could contribute to international differences in hurdle rates is differential investment risk.
Some managers may set hurdle rates above their required returns as a way to correct for overly optimistic cash flow projections in the projects they are asked to consider. This practice will inadvertently shorten corporate investment horizons. For example, consider a firm that has two projects, one lasting five years, the other ten years, with equal net present values when their cash flows are truthfully reported and they are discounted at the firm’s cost of capital. Assume that each project involves an up-front cost and then generates a stream of positive cash flows. If project proponents overstate the cash flows for each project by 10 percent in each year, and if senior management responds by raising the hurdle rate instead of scaling back cash flow projections, then the five-year project will appear to dominate the ten-year project when the managers compute their present values.
Most firms have more than one hurdle rate and vary it as a function of the type of project being considered. We asked the CEOs for the range of hurdle rates they use for sundry projects. The average difference between the highest and lowest hurdle rate is 11.2 percent (12.4 percent in manufacturing). (Figure 2 shows the distribution of the differences between the high and low rates.) Almost half the firms reported differences of more than 10 percentage points. To explore the source of such differences, we asked an open-ended question about the types of projects that are evaluated with high and low hurdle rates. The relatively few responses to this question suggested that strategic projects, such as entering new markets or defending market share, have low hurdle rates.
While about two-fifths of all firms and nearly half of the manufacturers use real hurdle rates between 10 and 15 percent, there are many with values substantially outside this range (see Figure 3). One-third use hurdle rates below 10 percent, while more than 10 percent have real hurdle rates in excess of 15 percent. The most common rate, reported by one-fifth of the respondents, is 10 percent. This could reflect either a response of a real hurdle rate of 10 percent, or a nominal hurdle rate of 15 percent.
Obviously, there is no reason to expect all firms to have the same hurdle rate; differences in the risk of typical projects or in access to capital markets could explain the variances. Do interindustry differences account for most of them? We estimated average hurdle rates for each of the two-digit SIC code manufacturing industries in our sample but found no statistically significant differences. In part, this conformity reflects the small number of firms in our data set for many two-digit industries. Industry affiliation explains only 12 percent of the variation in hurdle rates within manufacturing.
Even if industry affiliation does not predict a firm’s hurdle rate, other observable variables may. By merging our survey responses on hurdle rates with data from Standard and Poor’s Compustat database, we were able to explore the association between hurdle rates and a number of financial and related variables. The variables we tested for effects on hurdle rates included the P/E ratio, beta, the dividend-price ratio, the current ratio as a measure of leverage, the market-to-book ratio, and Tobin’s q ratio (the market value of the firm’s outstanding financial claims divided by the replacement cost of its assets). We also studied the link between time horizons and the fraction of institutional holdings or the annual turnover rate of the company’s stock. Including these variables allowed us to test the proposition that institutional investors, which trade more frequently than other investors, tend to shorten a firm’s time horizon. Finally, we broadened our search for correlates of firm horizons by collecting several characteristics of the CEOs, including tenure and MBA or finance background, and tested whether they could explain corporate hurdle rates.
Table 3 shows bivariate regression coefficients from simple linear regressions of the real hurdle rate on various firms’ financial or management characteristics. The results suggest that the set of variables can explain remarkably little of the interfirm variation in hurdle rates. The only variable for which we can reject the null hypothesis of zero correlation at standard statistical confidence levels is the current ratio, which has a high positive correlation. Firms with more current assets relative to liabilities tend to exhibit higher real hurdle rates, and an increase in the current ratio from one to two is associated with a change of nearly 300 basis points in the real hurdle rate.
We also found some evidence suggesting that firms whose CEOs have a finance background exhibit hurdle rates between 150 and 200 basis points higher than those with CEOs from other backgrounds. Not surprisingly, it is difficult to draw strong inferences from this finding. It could reflect a tendency for finance-based CEOs to adopt high discount rates. On the other hand, individuals with finance backgrounds may be attracted to industries with shorter-term projects. The evidence for a link between CEO background and firm horizons is weakened by studying the correlations with the share of long-term R&D, where there is a very weak negative relationship, particularly among manufacturing firms.
A striking conclusion is that none of the traditional financial variables that might proxy for risk, like the firm’s stock market beta, correlates with hurdle rates (see Table 3). That the price-earnings ratio, a standard input to most cost-of-capital calculations, does not seem to affect the firm’s discount rate is particularly surprising, although it is well understood that the P/E ratio depends not just on the discount rate applied to corporate earnings, but on the expected growth rate of those earnings as well. It is also surprising that Tobin’s q does not appear correlated with corporate hurdle rates, since a firm that consistently applied too low a discount rate in project evaluation would likely experience a decline in the q ratio.
Many allegations that U.S. firms have short planning horizons identify certain aspects of financial markets, such as some analysts’ short-term earnings focus, as key contributing factors. This view implies that the stock market may incorrectly value firms that are engaged in long-term R&D or other projects. To assess this possibility, we asked CEOs whether they regard their firms as undervalued. Nearly three-quarters of them think so. (One CEO told us that any respondent who answered that the firm is overvalued should be fired.) When asked to compare the undervaluation today and five years ago, 42 percent indicated that their firms are more undervalued today, 29 percent responded that the undervaluation was roughly equal then and now, and the remainder think they are more properly valued today.
We also investigated whether these perceptions were related to the characteristics of the CEOs or their firms. The results, which we briefly summarize but do not report in detail, suggested that the market-to-book ratio and Tobin’s q ratio are negatively associated with the probability that the manager views the firm as undervalued. However, none of the other variables we explored and, in particular, none of the variables about CEO background was associated with the probability of the CEO’s views of undervaluation.
One manifestation of the managers’ concern with market valuation is their close attention to investors. The average CEO reported 1.4 meetings per week with money managers and market analysts, and estimated that the firm’s CFO averaged 3.2 meetings with these groups.
Undervaluation may or may not be of interest per se, but it is of central concern with respect to investment decisions. We therefore asked how much the firm would increase its long-term investments if the stock market properly valued those investments. The average response, a 20.7 percent increase, suggests a nontrivial effect from perceived misvaluation. There was substantial dispersion in the answers to this question. While 7.3 percent of the responding CEOs indicated that they would bolster long-term investment by more than 50 percent if the market valued their stock accurately, 45 percent responded that they would raise long-term investment by less than 10 percent.
When asked whether their firms had ever decided not to undertake profitable investment opportunities because the stock market might penalize the decision, more than three-quarters (81 percent) of the respondents said that they had never passed up such opportunities, and fewer than 1 percent replied that they passed them up frequently. The apparent inconsistency of these two results suggests some caution in making inferences about the effect of perceived misvaluation on corporate investment.
International and Intertemporal Differences in Time Horizons
Most of the past decade’s policy debate about corporate time horizons has been stimulated by concern that U.S. firms have horizons systematically shorter than firms in other countries. This is a difficult issue to resolve with a survey of U.S. managers because they may have limited information about foreign competitors’ planning practices. The alternative, surveying both U.S. and foreign managers, also has drawbacks, since the same question might be interpreted differently. Nevertheless, we adopted both approaches.
We asked U.S. CEOs how their firms’ time horizons compare with those of their principal European and Asian competitors. Not all respondents answered both questions, which presumably reflected the absence of competition. (Table 2 shows the average responses; Figure 4 displays their distribution.)
Most U.S. CEOs think their Asian competitors have longer time horizons than they do. The average response was 3.77 (3.80 in manufacturing), and all but 6 percent of the respondents indicated that Asian competitors have horizons at least as long as their firms. The results for European competitors are less striking: the average response of 3.2 suggests slightly longer horizons at the European firms, but 21 percent of the respondents believe their firm has a longer horizon than the European competition.9 Figure 4 shows that the intensity of CEO opinion was much stronger with respect to Asian than European competitors.
We also investigated the differences between U.S. and foreign firms by sending our survey to fifty of the largest firms in Japan, Germany, and the United Kingdom. Our response rate, even after sending follow-up faxes, was very low from Germany (4 percent) and low from the United Kingdom (16 percent). From Japan, however, the response rate of 22 percent was comparable to that of the U.S. survey. But we must emphasize that, even for Japan, our sample size is very small and the results must be viewed as only suggestive (see Table 4 for these responses).
The foreign firms devote much larger shares of their R&D budgets to long-term projects than their U.S. competitors do. The differences are marked — a factor of two relative to U.S. firms and a factor of three for European firms. Some apparent differences prevail in the importance of hurdle rates in capital budgeting: U.S. firms report an average value midway between “very important” and “somewhat important,” while European respondents are closer to “very important” and Japanese respondents are closer to “somewhat important.”
Comparing the real hurdle rates of U.S. and foreign firms is difficult, because most firms report nominal hurdle rates and inflation rates differ among countries. It is nevertheless possible to learn something about relative hurdle rates from the reported nominal values. In Japan, two-thirds of the firms that reported hurdle rates use nominal discount rates of less than 10 percent. Even if inflationary expectations were zero, these firms would be discounting future projects at real hurdle rates below the average for the U.S. firms in our sample.
The pattern differs in Europe, where the only firms indicating hurdle rates below 10 percent were reporting in real terms. The average real hurdle rate for the European firms, assuming an expected inflation rate of 5 percent, is 12.9 percent, slightly higher than the average value for U.S. firms.
We asked the European and Japanese CEOs to compare their firms’ time horizons with those of their principal U.S. competitors. The responses confirmed the answers on the U.S. surveys. The average response from Japanese firms was 1.9, compared with an average response of 3.8 in the survey of Americans about Asian competitors. The Japanese CEOs also think their firms have longer horizons than their European competitors, but the disparities are smaller (2.4). The average responses from European CEOs, 2.6, confirms the U.S. survey evidence of slightly shorter time horizons at U.S. than at European firms.
While the survey results discussed so far suggest that U.S. corporations have shorter time horizons than their German or Japanese competitors, they do not provide any evidence on whether shortened time horizons are related to shifting U.S. competitiveness in the 1980s. To learn more about this issue, we asked CEOs to compare their firms’ time horizons at the time of the survey with those five and ten years ago. Unfortunately, these responses are likely to be among the least reliable in our survey because they require comparisons of corporate behavior over relatively long time periods. Most of the CEOs in our sample were probably not in their current jobs ten years before the survey.
Most respondents indicated that their firms’ horizons had, if anything, lengthened during the 1980s. Only 24 percent of the respondents (22 percent of those at manufacturing firms) viewed their firms as having shorter horizons on the survey date than ten years earlier. The results from the question about the past five years are similar, and they cast doubt on the common claim that changes in financial markets during the 1980s shortened corporate horizons.
We tested the robustness of our questions by asking CEOs to compare their firms’ horizons with those of their principal domestic competitors. Most CEOs think their firms take a longer view than their rivals. The average response, 2.4 on a scale between 1 (their firm takes a much longer view) and 5 (their firm is much more shortsighted than competitors) may suggest a tendency to underestimate competitors’ horizons.10
How Public Policies Affect Time Horizons
To explore how various public policies affect corporate hurdle rates and time horizons, we asked our survey respondents to describe the effect of seventeen changes in the economic, financial, or policy environment on their firm’s planning horizons. The responses are coded between 1 (would significantly shorten horizons) and 5 (would significantly lengthen horizons).11 (Table 5 shows the average responses for each hypothetical situation and the complete distribution for each change.) One immediate conclusion that emerges is that CEOs think that relatively few changes would have serious effects on planning horizons.
Tax policies received the highest marks as policies that could lengthen time horizons. A cut in the corporate tax rate from 34 percent to 25 percent, a permanent R&D tax credit, and allowing half of corporate dividend payments to be deductible from corporate tax were the three policies with the greatest effect in lengthening corporate time horizons. The next two horizon-lengthening policies were a 20 percent increase in corporate earnings and a credible commitment to no changes in the tax system for a decade.
While interpreting the level of the responses to the policy questions in Table 5 is difficult, comparing relative responses to different hypotheses is less problematic. The five policies noted above are therefore of interest because they are viewed as having sharper effects than an investment tax credit of 5 percent on equipment or a reduction in the capital gains tax from 28 percent to 20 percent. With respect to capital gains, the responses suggest that a targeted policy of reducing the tax rate for gains on common stock would have a smaller effect on time horizons than an across-the-board capital gains rate cut.12
Corporate respondents view an increase in their companies’ share prices as one shock that would lengthen time horizons but see little difference between the effect of a marketwide increase in prices and a firm-specific price increase. A 100 basis-point decline in interest rates, however, had a much larger perceived effect on corporate horizons than a 20 percent rise in share prices. Respondents see little difference between the effect of a change in interest rates caused by rising inflationary expectations and one caused by the Federal Reserve’s monetary tightening, even though the former could shift nominal interest rates with no effect on real interest rates, while the latter would presumably shift real rates.
We asked how several changes in corporate control rules would affect time horizons. The CEOs indicated that a national antitakeover statute like the one Pennsylvania adopted in 1990, which made it much more difficult for a raider to take control of a firm and change its operating characteristics or sell existing assets, would lengthen horizons. The two other changes in control structure we asked about — a block purchase of common stock by a friendly shareholder and the institution of minimum holding periods before common stock could be voted — had slight effects in lengthening corporate horizons.
The correlation between a given CEO’s view on one policy and his or her view on a different matter was quite low. Some patterns do emerge, however. There is a strong positive correlation between horizon-lengthening responses to cutting the corporate tax rate, restoring the investment tax credit, and introducing a permanent R&D tax credit. Replies to pairs of suggested hypothetical change — for example, the pair on allowing shareholders (firms) to receive a tax credit for dividends received (paid) — correlated well.
Conclusion
Our analysis suggests several conclusions about the time horizons and hurdle rates of U.S. corporations and their international competitors. First, the hurdle rates most U.S. firms use in their capital budgeting procedures are higher than standard cost-of-capital analyses would suggest. The average discount rate applied to constant-dollar cash flows was 12.2 percent, distinctly higher than equity holders’ average rates of return and much higher than the return on debt during the last half-century. If firms are actually using the hurdle rates they reported to make decisions, they may be turning down projects that would be profitable from the shareholders’ perspective.
Second, U.S. CEOs believe that their firms had systematically shorter time horizons than their major competitors in Europe and, especially, Asia. This result does not seem to reflect some form of “managerial paranoia,” since the same CEOs think that their firms have longer horizons than their typical domestic competitors. Moreover, the beliefs of U.S. CEOs appear to be shared by their foreign counterparts. Our limited survey of managers in Japan, Germany, and the United Kingdom shows that foreign CEOs agree that their firms take a longer view than their U.S. competitors.
Third, CEOs believe that government policy is a powerful agent affecting corporate planning horizons. Several policy reforms, including a cut in corporate tax rates, a permanent R&D tax credit, a corporate tax deduction for dividend payments, and a credible commitment to a stable tax policy for the next decade, could lengthen planning horizons. CEOs see these policies as more attractive than restoration of the investment tax credit for equipment, a capital gains tax cut, various anti-takeover changes in corporate control regulations, or a tax on short-term trading.
References
1. For recent data on manufacturing productivity in the United States, Japan, and other G-7 nations, see:
E.R. Dean and M.K. Sherwood, “Manufacturing Costs, Productivity, and Competitiveness, 1979–1993,” Monthly Labor Review 117 (1994): 3–16.
2. For a summary of the policy debate about the role of time horizons in exacerbating the competitiveness problems of U.S. firms, see:
M. Jacobs, Short-Term America (Boston: Harvard Business School Press, 1991).
For a survey of studies on the cost of capital in U.S. and Japanese firms, see:
J.M. Poterba, “Comparing the Cost of Capital in the United States and Japan: A Survey of Methods,” Federal Reserve Bank of New York Quarterly Bulletin, Winter 1991, pp. 20–32.
For a discussion of various policy measures that might lengthen corporate time horizons, see:
National Research Council Board on Science, Technology, and Economic Policy, Investing for Productivity and Prosperity (Washington, D.C.: National Academy Press, 1994).
3. There are dozens of studies of corporate capital budgeting practices. See, for example:
L. Schall, G. Sundem, and W. Geijsbeek, Jr., “Survey and Analysis of Capital Budgeting Methods,” Journal of Finance 33 (1978): 281–287; and
J. Binder and J.S. Chaput, “A Positive Analysis of Corporate Capital Budgeting Practices” (Chicago: University of Illinois-Chicago, mimeo, 1991).
However, the competitiveness policy debate has largely ignored them.
4. A copy of the survey is available from the authors on request.
5. In April 1991, we also sent the questionnaire by fax to the fifty largest firms in Germany, Japan, and the United Kingdom. We discuss these responses later.
6. We view both the long-term R&D share and the hurdle rate as measures of corporate time horizons. We therefore examined their correlation in our sample and found that the share of long-term R&D is (weakly) negatively correlated with the real hurdle rate.
7. Ibbotson Associates reports a geometric average return of 10.3 percent (nominal) on common stocks of large firms, 12.4 percent on common stocks of small firms, 5.6 percent on long-term corporate bonds, and an inflation rate of 3.1 percent for the 1926–1993 period. See:
Ibbotson Associates, Stocks, Bonds, Bills, and Inflation: 1994 Yearbook (Chicago: Ibbotson Associates, 1994).
8. M.S. Feldstein, J.M. Poterba, and L. Dicks-Mireaux, “The Effective Tax Rate and the Pretax Rate of Return,” Journal of Public Economics 21 (1983): 129–158.
9. Competitors of the firms we analyzed may not be representative of Asian or European firms; they may be more export oriented and potentially longer horizon firms than companies engaged only in domestic sales.
10. Another explanation for this finding is that the CEOs who responded were more attuned to problems of time horizons than a purely random sample. Their firms could typically have longer time horizons than their domestic competitors.
11. We present detailed information on the responses to each question because two questions may have identical mean responses but quite different distributions in the intensity of views. Two questions may have equal average responses (say, 3), but one might have an equal number of 2, 3, and 4 responses, suggesting no very strong views on this policy, while another could have the same mean but half of the respondents indicating 1 and the other half 5. Table 5 provides this information.
12. This is a surprising finding since a “rifle-shot” capital gains tax cut for equities would make them more attractive than other gain-producing assets, reducing the cost of equity more than a capital gains tax cut for all assets.