Calculated Risk: A Framework for Evaluating Product Development
Product development is often viewed as secondary to research, particularly in technology industries. But failing to attribute strategic importance to the product development that commercializes technology investments ignores the fact that successful technology innovation often fails to produce commercially successful products. In fact, it is investment in new-product development that is the single strongest predictor of a company’s future value.1
The product-development process, however, is often seen as an undependable black box that rarely produces results that exceed business expectations. Traditional financial models have limited success exposing the numerous product-development risks that underlie the assumptions in a typical business case. Net present value (NPV) remains the most commonly used decision-making tool in product development, but has been criticized for not properly accounting for uncertainty and project flexibility — that is, multistage development funding and abandonment options.2 Decision trees more accurately capture the multistage nature of development, using probability-based expected monetary values, but can be time-consuming and complex to construct. An emerging alternative to decision trees is real options,3 a technique that applies financial options theory to nonfinancial assets and encourages managers to consider the value of strategic investments in terms of risks that can be held, hedged or transferred. However, the real options technique has yet to be widely implemented for product development, because the ability of public markets to hedge project-specific “private” risks is incomplete and organizational and information hurdles limit adoption. Applying the same rules to development as they do to research, managers often accept unpredictable performance.
However, a robust product-development process can make the inherent risks understandable and to some degree measurable and controllable. Key to this effort are the stage-gate product-development processes in which ideas are evaluated incrementally at successive stages of substantiation. The initial filter or “gate” is the brainstorming stage, during which many ideas are generated, but a good portion is discarded. The next gate is the preliminary scope of the idea in an attempt to match it to existing goals and constraints. Those ideas that “seem reasonable” by those criteria pass through to the third gate, or business case stage, which filters out those ideas not economically viable or strategically valuable. The goal is to kill projects whose economics become negative. Risks are minimized by keeping investments small for projects that ultimately fail to make the grade.
The net present value risk-adjusted (NPVR) framework developed at Product Genesis enhances the stage-gate decision process by explicitly addressing critical risk factors in traditional return on investment (ROI) models. Decision trees and real options are viable alternatives, but are more complex and require information that may not be readily available early in the development process. By focusing on a few critical assessment areas, key development risks are exposed, and the predictability of new product development is improved. Since NPVR addresses the economics of the proposal, it is a gate-three tool. The result is faster development of products that better meet market and user requirements and therefore generate higher ROI.
The Limitations of Traditional Financial Models
To illustrate the challenges facing decision makers, consider the following simplified example of a product-development justification. It represents the typical level of information available for assessing risk when a business case stage-gate decision is reviewed.
A product sponsor at a midmarket electronics manufacturer proposes a $20 million development program to create a hand-held wireless organizer that will be marketed to high-school students. The business case is presented as having the following bottom-line financials:

In the example, a $20 million investment produces a product with forecast sales of $52 million over the product’s expected life cycle. Financially, the project looks good — a traditional discounted cash flow analysis shows a net present value (NPV) for the investment of more than $15 million at the company’s opportunity cost of capital of 15%. The internal rate of return (IRR), another popular measure, is an impressive 53%. Should the proposal be approved? It depends upon the assumptions and the risks that underlie them. However, traditional financial models provide little if any insight into those assumptions.
In this business case, the company currently generates most of its revenues from industrial wireless devices for inventory control sold on an OEM basis. The hand-held organizer will use technology and manufacturing expertise developed for these inventory control devices. A skunk works group within R&D has created a rough prototype of the hand-held organizer, although actual product development will require assembling a new team. Marketing has had “promising” discussions with a leading school-supply company, and that company is looking for a product that will be a high-tech winner among students. Preliminary market research suggests there is nothing like it available today.
The business case reveals one of the challenges inherent in reviewing traditional proposals: They describe risks in a way that is designed to persuade rather than inform.
Complex spreadsheet models, even those including sensitivity analysis, produce outputs that depend on numerous subjective assumptions. Few product-development practitioners would not confess to optimism in their assumptions to support a favored proposal, safe in the knowledge that there is little possibility that the assumptions will be challenged. Particularly in the early stages, detailed estimates can be off by orders of magnitude.4
As a result, senior executives often spend little time in the early stage of product development,5 since it is unfamiliar territory and the combination of overwhelming technical detail and high ambiguity limits their ability to influence the direction of product development meaningfully. Risk factors are often presented in narrative form steeped in technical methods and jargon, making it difficult for managers who are not experts to make informed judgments. Decision makers can rarely undertake independent, detailed analysis of every proposal and often rely on informal risk evaluation, driven as much by the knowledge that the proposal’s sponsors have a career stake in the product’s success than by trust in the underlying business models.
By introducing a framework with a common, familiar vocabulary and identifying the risks of different product portfolio categories, senior executives can meaningfully re-engage in the process since their judgment is often as valuable in assessing risk as in using detailed formal models. The NPVR framework is designed to bridge this “judgment gap” in which decision makers are called upon to determine whether the results of a formal model can be expected to produce real-world success.
R vs. D — The Difference Between Uncertainty and Risk
A common mistake made by decision makers and practitioners alike is confusing the notions of uncertainty and risk, especially as they apply to research and development. Uncertainty is a property of nature that resists quantification, and therefore cannot be effectively reduced to probabilities and scenarios. Risk is by definition quantifiable and manageable.
In any research phase, knowledge must be discovered, but objectives are unclear (for example, discover a new treatment for heart disease), measurements of success are ambiguous (for instance, create a more efficient wireless communication protocol) and the process for controlling research does not significantly affect success or failure in discovery and innovation.
When a chief technology officer speaks of technology risk, it is likely he or she is really talking about uncertainty as to what knowledge must be discovered for a given technology to work. That is the ever-changing measure known as state of the art. Once discovered, state of the art represents the benchmark where research uncertainty ends and manageable development risk begins.6
In research, the challenge is overcoming technology that may not work. In development, the challenge is avoiding products that may not be successful. This definition of development risk should not be interpreted to mean that technical risks are eliminated — there are still considerable challenges to overcome in design, engineering, human factors and other areas. But it is important to evaluate research separately from product development to avoid the erroneous conclusion that product-development success cannot be effectively managed.
Product-Development Portfolios
Product-development portfolios are traditionally divided into four categories as a function of market and product risk and expected return (see “Product Portfolio Categories”). They can also be used to better assess the risks that determine the chances for success in each category.
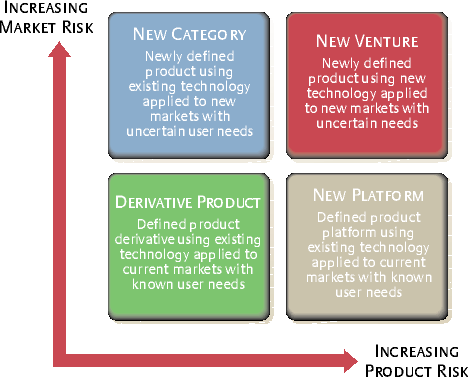
New Ventures are “new to the world” products, representing the first of their kind and creating an entirely new market — for example, portable MP3 music players. Although new ventures are most often associated with startups, the term is equally applicable to innovation in established companies. These products represent only about 10% of all new products, although in high-tech companies the figure may be as high as 20%.7
New Categories are “new to the company” products and include new product lines that target an established market in which the company does not currently compete — for example, Sony’s entry into personal computers with its VAIO products.
These products, including the repositioning of existing products, represent 27% of all new products, although in high-tech companies the number may be as high as 39%.
New Platforms are most often additions to existing product lines, although the products themselves may be quite innovative. Platforms create the basis for future derivative products when new technology, improved market knowledge and manufacturing know-how become available. For example, most cellular telephone products, such as the Nokia 5xxx line, are platform-based. For all companies, these products represent 26% of all new products — although in high-tech companies it may be as low as 20%.
New Products are derivative improvements and revisions to existing products, including cost reductions — for example, the many evolutions of Hewlett-Packard’s popular inkjet printers. For all companies, these products represent the largest category of development investment at 37%, although in high-tech companies this figure may be as low as 22%.
Risk Assessment in Product Portfolios
The following framework was developed to indicate which are the most salient risks — market risk, technical risk or user risk — in each of the four product portfolio categories (see “Risk Weighting by Portfolio Category”). Marketing risk factors include the company’s current position in the target market and those factors required to successfully bring a new product to market. Technical risk factors are related to the company’s understanding of the technology and its ability to assemble an effective development team. User risk factors are related to the consumer’s and the company’s understanding of his or her needs.

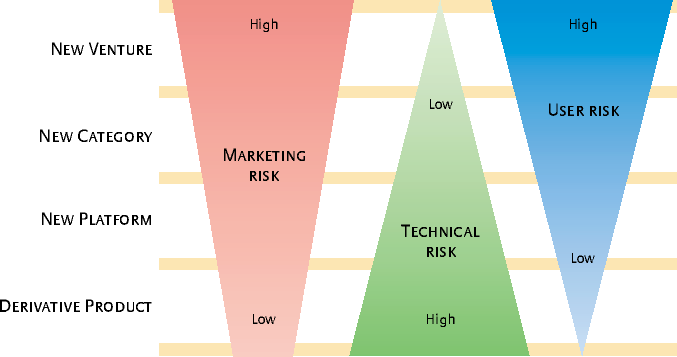
Note that these are not measures of absolute risk, but of which risks, at the business case stage, are most likely to have an impact on future commercial success. For example, there are significant technical risks in a new venture, yet it is most often lack of market or user understanding that causes a product to fail. That is evidenced by the large number of failed new ventures with successful prototype technology that died in search of customers. Building the “better mousetrap that nobody wanted”8 is the most common cause of new-product failure (28%), particularly for technology-driven businesses.
By contrast, commercial success for derivative products is primarily driven by technical development. User needs and market strategy are generally well understood, and the greatest influence on success becomes the ability to achieve cost reductions or feature enhancements on time and within budget. The risk here is a product that falls short of requirements.
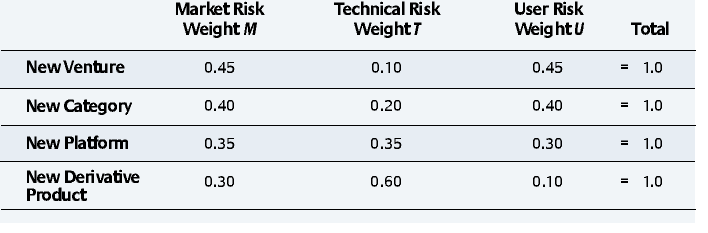
This relative weighting of market, technical and user risks will vary by industry and technology. The relative weight of each risk in the framework has been quantified for medical, commercial and industrial (primarily electromechanical) products by reviewing successes and failures in a database of more than 200 product-development case histories (see “Risk Weighting by Development Category”). A similar approach could be used to weight different industries and product technologies. By differentially weighting the subjective assessment of risk for each portfolio category, decision makers can exercise better judgment in selecting among proposals for financially similar investments and undertake appropriate risk investigation and reduction that can significantly affect the overall success of the company’s product-development portfolio.

NPVR — A New Model for Product-Development Evaluation
Assessing technology and product risks has been discussed in academic circles since the mid-1970s, and it remains an active area for researchers and practitioners alike. For example, former Xerox senior managers George C. Hartmann and Mark B. Myers have described work at that company to quantify research and market risks.9 This framework builds on their work and is specific to product-development risks. It offers quantitative tools designed to increase ROI in product development by increasing the probability of commercial success.
Traditionally, product-development risk has resisted frequency-based measures that rely on analysis of repetitive trials, since often little useful historical data exists. Sensitivity analysis can be used to vary assumptions in the NPV model to determine their impacts, but it is often difficult to define the impact of risk on those assumptions. More rigorous risk-management approaches, such as real options models, are promising but are little used in practice.
The NPVR model instead relies on using experience and judgment to subjectively assess risk relative to one or more well-defined extreme situations, for example, guaranteed success or failure. It assesses the strength of a business case in six key areas of technical, market and user needs risks. Since risk assessment at the business case stage is subjective and numerical estimates underlying NPV assumptions often introduce significant error, the NPVR model uses a risk scoring vocabulary that is common across portfolio categories. Rather than demanding an estimate of probability, the NPVR model scores risks as having a high, medium and low ranking of success. By relying on a simple, qualitative vocabulary for risk assessment, the model avoids the common but unproductive discussions that can occur about the precision of estimates. It is more useful to understand whether the chances of success are high or low than to seek consensus on whether the numbers are 83% or 17%. Qualitative assessments can be easily converted to numerical values after a consensus emerges. In the NPVR model, this is done by assigning the most positive ranking (high chance of success) a value of 5, and the most negative ranking (low chance of success) a value of 1, on a 1-to-5 scale. These numerical rankings, whenever less than the highest value of 5, reduce the original proposal’s NPV to account for risk exposure.
Using these common assessments of relative risk exposure, decision makers may compare a risk-adjusted NPV to that presented by the proposal’s promoter. It gives decision makers some understanding of what part of a proposed business case’s NPV is at risk by focusing on the key factors important to commercialization of research. It reflects how risks may affect NPV for different proposals by weighting exposure by portfolio category. And it allows diverse projects to be evaluated quickly and consistently by applying a scoring-based approach.
Evaluating Market Risk
Market risk encompasses any element of the value chain required for any new product to reach its potential customers. That includes such factors as sales force capabilities, distribution channels, manufacturing capabilities and customer support. Each element should be understood and evaluated. In addition, success will be influenced by the company’s current presence in the target market segment. Scoring criteria for market risk are summarized as follows:

A score of medium is a warning that the underlying assumptions may be suspect, while a score of low requires that a strategy be developed to increase the probability of success before approval. If the strategy is not identified in the proposal or appropriate resources are not available within the company, outside partners can provide part of the solution. Outside businesses can provide an objective viewpoint and specialized knowledge that can deliver better understanding of value chain and market segment risks.
Returning to our wireless organizer example, the fact that the company has existing wireless manufacturing expertise and an identified marketing partner would result in an evaluation of medium (numerical equivalent of 3) for this risk factor. However, the assessment of the education market segment would be low (numerical equivalent of 1).
Evaluating Technical Risk
Technical risks focus on the innovation associated with the product as well as the development capabilities of the company. Scoring of these factors is summarized in the following table:
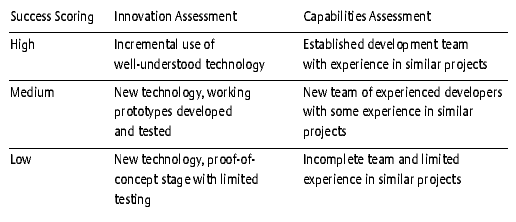
Innovation risks must be evaluated not only in terms of the technology itself, but also the degree to which the technology is integrated with the company’s existing product-development processes and manufacturing. Capabilities assessment should include the development team and its supporting program management. Appropriately used, outside product-development partners can provide technical skills and established, experienced teams that can significantly mitigate risk — if they are well-integrated into the firm’s new product-development process.
In the example, the company has experience with wireless technology and a working prototype. The innovation assessment would be high (numerical equivalent of 5), since the company is essentially adapting an existing technology. The nucleus of a development team with relevant experience is also in place, which would result in an evaluation of medium (numerical equivalent of 3) for this technical risk.
Evaluating User Risk
While market risk determines the company’s ability to sell and support the product, and technical risk determines its ability to build the product, user risk determines the likelihood that the company is developing the right product. User risk assessment focuses on the degree to which the attributes of user interaction with the product are known and the degree to which design and performance specifications are known. Scoring of these attributes is summarized in the following table:
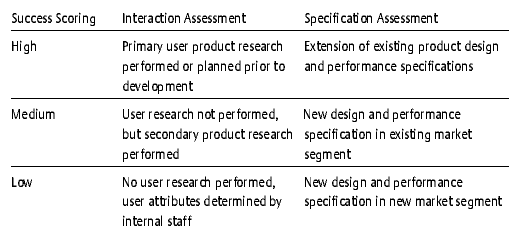
In our example, the company has developed its business case relying almost entirely on internal assessments of user needs and product requirements. This results in a low score for both interaction and specification, particularly in light of the low score already given to market segment understanding. There is great risk that the company does not truly understand the product’s requirements, and therefore it must develop a strategy to address the lack of user research before approval.
Calculating NPVR
NPVR is calculated in the following way:
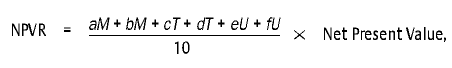
where a, b, c, d, e and f are the value chain, market segment, innovation, capabilities, interaction and specification assessments, respectively, each of which has been ranked on a 1-to-5 scale. The values for the risk weighting, M (market), T (technical) and U (user), are determined by questioning the proposal sponsor, referring to business case data, and then assigning the proposal to a portfolio category. In our example, the proposed organizer falls into the “new category” classification for this company, so the corresponding weighting factors (see “Risk Weighting by Development Category”) are M = 0.4, T = 0.2 and U = 0.4. The net present value for the proposed investment in the example is $15 million.
Using these factors, the NPVR for the hand-held organizer proposal is
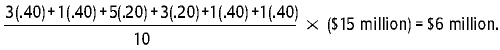
NPVR therefore is only 40% of the original NPV, indicating that 60% of the sponsor’s projected NPV value is at risk. How the NPVR is integrated into the stage-gate decision process will vary by company, but this level of reduction should indicate that additional work on the business case is needed for the proposal to be successful.
Enhancing Product-Development Success Using NPVR
In the example, the greatest risk exposure lies in the company’s lack of understanding of what user design features high school students expect from a wireless organizer. Consequently there is a lack of a robust product specification to address those requirements and the demands of the company’s potential distribution partner to bring the organizer to market. As presented in the business case, the user perspective has been generated entirely internally, and that runs the risk of creating the better mousetrap that nobody wanted.
The NPVR model provides insight into how additional user research might affect the success estimates for the proposal. For example, conducting user research early in the development cycle could improve the assessment of interaction risk e, changing the possibility of success in that area from low to high. Substituting the new value in the calculation improves the NPVR to (5.6 ÷ 10 × original NPV) or $8.4 million, a significant improvement over the $6 million originally presented. Thus, the company should consider investing in primary user research to reduce the at-risk portion of the product’s expected ROI.
Of course, there is no guarantee that the product will succeed in absolute terms if the research is undertaken, but in comparing proposals within a category, those with predominately high scores are more likely to succeed than those with low scores. Similar analysis can be performed to evaluate risk mitigation along any technical, market or user risk element. The stage-gate development process defines a game plan for improving the chances that new products will be commercially successful. NPVR gives decision makers a better way to keep score in that game.
References
1. R.G. Cooper, “Winning at New Products” (Reading, Massachusetts: Perseus Books, 1993), 6.
2. See K. Vlahos, “Tooling Up for Risky Decisions,” in “Mastering Risk. Vol. 1. Concepts,” ed. J. Pickford (Upper Saddle River, New Jersey: Prentice Hall, 2001), 47–52.
3. See J.J. Reuer and M.J. Leiblein, “Real Options: Let the Buyer Beware,” in “Mastering Risk. Vol. 1. Concepts,” ed. J. Pickford (Upper Saddle River, New Jersey: Prentice Hall, 2001), 79–85.
4. R.A. More and B. Little, “The Application of Discriminant Analysis to the Prediction of Sales Force Uncertainty in New Product Simulations,” Journal of the Operations Research Society 31 (1980): 70–77.
5. E.B. Roberts, “Generating Effective Corporate Innovation,” Technology Review (October–November 1977): 27–33.
6. For a more comprehensive treatment of risk and uncertainty, see P.A. Roussel, K.N. Saad and T.J. Erickson, “Third Generation R&D” (Boston: Harvard Business School Press, 1991), 67–86.
7. Booz Allen & Hamilton, “New Product Management for the 1980s” (New York: Booz Allen & Hamilton, 1982).
8. Cooper, “Winning,” 12.
9. For a complete description of risk quantification at Xerox, see G.C. Hartmann and M.B. Myers, “Technical Risk, Product Specifications, and Market Risk,” in “Taking Technical Risks,” eds. L.M. Branscomb and P.E. Auerswald (Cambridge, Massachusetts: MIT Press, 2001), 30–43.
Comments (3)
Josh George
Jamey K
Jeffrey Evans