Portfolios of Buyer-Supplier Relationships
Topics
During the past few years, the business press and academic literature have been exhorting managers to move away from arm’s-length relationships and move toward longer-term collaborative strategic partnerships with external business partners. This advice comes as a natural reaction to the numerous empirical studies conducted during the past decade that compare Japanese production and supply practices with those of the rest of the world.1 The now mythical link between Toyota’s success and the effective management of its suppliers has led to a leap of faith in Western management circles, where managers and business consultants tout strategic partnerships as the next core competency and source of competitive advantage. In the automobile sector, for example, all three U.S. manufacturers, and most of their European competitors, including Renault, Peugeot, and Volkswagen, have launched programs to decrease their level of vertical integration, reduce their total number of direct suppliers, and move toward publicly declared strategic partnerships.
Do Japanese firms manage primarily by partnerships? Empirical data on supplier relationships in the United States and Japan across a representative set of components and technologies show this common assumption to be unjustified. While strategic partnerships create new value, they are costly to develop, nurture, and maintain. In addition, they are risky, given the specialized investments they require. As an alternative, in this article, I propose and empirically validate a framework for managing a portfolio of relationships. My purpose is to help senior managers answer two key questions. First, which governance structure or relational design should a firm choose under different external contingencies? This is a strategic decision because it affects how a firm defines its boundaries and core activities. Second, what is the appropriate way to manage each different type of relationship? This is an organizational question.
Types of Relationships
As part of a broader project on supplier relationships, I administered a survey questionnaire, in English and Japanese, to a total of 447 managers in all three U.S. and eleven Japanese automobile manufacturers.2 Each informant or boundary spanner (i.e., a purchasing agent or engineer) responded for only one product and one supplier for which he or she was responsible. As a result, I obtained comprehensive information about the external and internal aspects of each relationship: the data included multiple items about (1) the component and its technology; (2) competition in the upstream market; (3) the supplier itself; (4) the nature of the boundary spanner’s job; (5) the internal workings of the relationship, that is, the contractual conditions, the social climate, and the extent and type of information exchange within the relationship; and (6) the performance of the relationship. Unique to the study was the systematic control for, and selection of, a representative cross-section of products, so as to avoid a data set with mostly self-selected strategic partnerships.
Searching for naturally occurring patterns within the data, I found a set of management variables that tend to co-vary together and interact with one another in creating effective supplier relationships. In particular, I discovered that the level of specific investments made by either partner to the relationship significantly correlates with practices commonly associated with strategic partnerships, such as long-term relationships, mutual trust, cooperation, and wide-scope relationships that include multiple components.3 These are investments that are difficult or expensive to transfer to another relationship or that may lose their value when redeployed to another supplier or customer. The mutual exchange of specific investments therefore appeared as an interesting and valid criterion to use to compare the relationships in the data set.
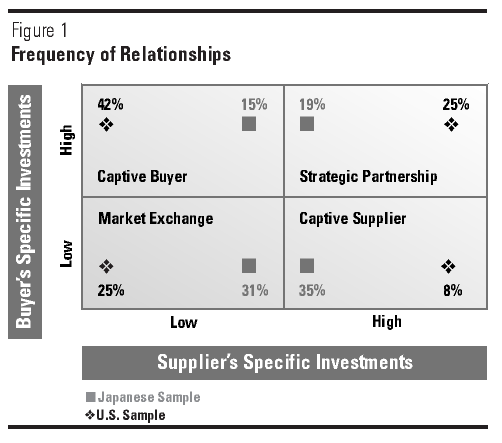
When I segmented the two national samples into four generic cells using this criterion, I was startled by the result (see Figure 1). The vertical axis represents the buyer’s specific investments. These are tangible investments in buildings, tooling, and equipment dedicated to the supplier or in products and processes customized to the components procured from the supplier. Special tools and dies are built or lent specifically for the component delivered by the supplier. This customization can, in turn, lead to tailoring some of the design work to some key components (such as air conditioning or wire harnessing): customization breeds more customization.
Buyer’s investments also include intangible investments in people or in time and effort spent learning the supplier’s business practices and routines or spent exchanging information, best practices, and knowledge to further develop and nurture the relationship. This is time and effort, of course, not spent developing new business opportunities with another supplier; the benefits of these initiatives accrue primarily to this single relationship. The horizontal axis represents the supplier’s specific investments. Tangible investments include plant or warehouse location or layout and specialized facilities and dies. Intangible investments include sending guest engineers and developing information systems compatible with the buyer’s proprietary databases or electronic data interchange protocols.
In the “strategic partnership” cell, both parties have posted highly idiosyncratic assets into the relation- ship. Economists call these assets “credible commitments” or “hostages”; practitioners speak of “real commitment” or “tying their hands to each other.” I met managers in U.S. and Japanese supplier companies who were cynical about their large customers’ offensively managed strategic partnership programs and emphasized the lack of reciprocity in the relationship. One manager complained, “We are tired of this smooth talk about ‘let’s work in partnership.’. . . We want them to put their money where their mouth is.” She added that “under the promise of more business, a long-term commitment, and a trust-based relationship, they [the customer] are squeezing us even more than before.” A purchasing agent at a major Japanese car manufacturer admitted that one of his long-term suppliers “has become complacent and . . . is free-riding our partnership.”
The “market exchange” cell represents the cluster of relationships in which neither of the parties has developed specialized assets to work with the other; they can work together using general-purpose assets. Each party can turn to the marketplace and shift to another business partner at low cost and minimal damage, hence the label. The “captive buyer” cell refers to those asymmetric relationships in which the buyer is held hostage by a supplier free to switch to another customer. Finally, in the “captive supplier” relationships, the supplier enters the trap of unilaterally making idiosyncratic investments to win and keep the business with the customer.
Managing a Portfolio of Relationships
The research findings counter the popular belief that Japanese firms have a propensity to manage their suppliers with highly dedicated relationships, or strategic partnerships (see Figure 1). They appear to conduct their business with a smaller ratio of strategic partnerships than is commonly believed (a mere 19 percent of the sample) and to make extensive use of market-exchange relationships (31 percent of the total), a practice usually associated with Western manufacturers. Similarly, while some 25 percent of U.S. automakers engage in market-exchange relationships, another 25 percent have been aggressively streamlining their supply base and have developed mutually committed relationships with a select group of suppliers. U.S. and Japanese firms alike balance a portfolio of different types of relationships rather than rely on only one type. Not surprisingly, firms in both countries are involved in market-exchange relation- ships. After all, there are thousands of different components in the assembly of today’s vehicles, many of which qualify as commodities and would not necessarily be integrated into a larger subsystem.
As for differences between the two countries, the most significant is the relative importance of captive-supplier relationships in Japan (35 percent) and captive-buyer relationships in the United States (42 percent). Japanese companies seem to face a market structure in which they can hold suppliers hostage and demand that they make specialized investments to get and keep their business.4 Important customers such as Nissan or Honda can demand that suppliers locate a plant or warehouse near their assembly plant, provide them with internal cost structure data, or send a quality engineer to the final assembly line. On the other hand, these buyers keep their options open and typically split the procured volume among multiple locked-in suppliers, even for the same component or technology. These are not strategic partnerships since the buyer does not commit specialized assets. In contrast, U.S. automakers face a supplier base that is reluctant to tie its hands to any particular buyer and prefers to maintain substantial business with most key domestic and international customers.
Are there any performance differences among the four cells of Figure 1? I found no statistically significant difference. No one type of relationship, not even the strategic partnership, is inherently superior to the others. Each cell contained low- and high-performing relationships, suggesting that each type of relationship can be well or poorly managed. Successful supply-chain management therefore requires the effective and efficient management of a portfolio of relationships: first, firms must match the optimal type of relationship to the various product, market, and supplier conditions; second, they must adopt the appropriate management approach for each type of relationship. Supply-chain management failure is the result of a mismatched relational design or a poorly managed appropriate design.
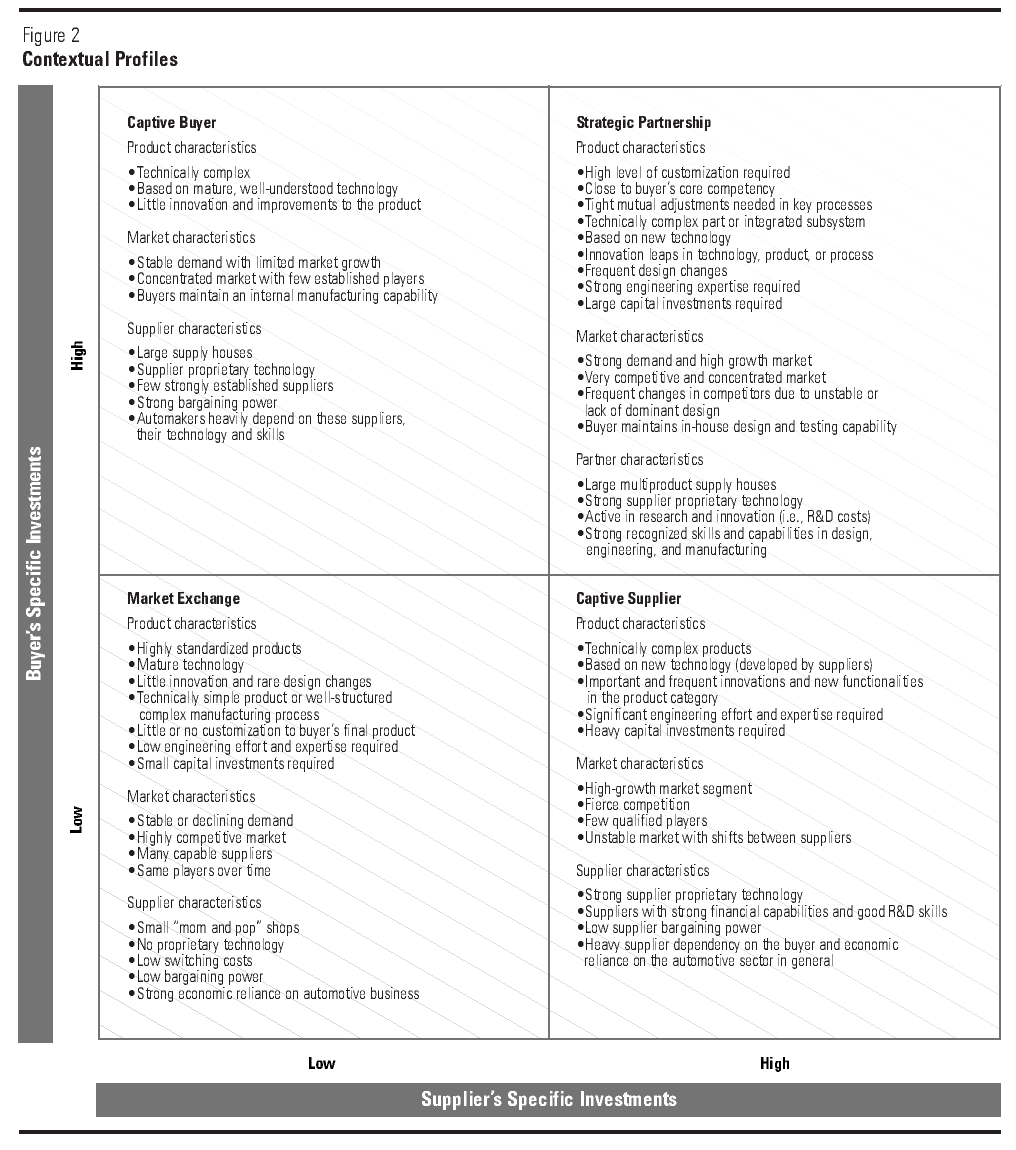
This conclusion raises two questions. First, how do U.S. and Japanese firms balance their portfolio of relationships? How, for example, can managers determine when a captive-buyer design is more appropriate than a strategic partnership? Second, how differently should a firm manage one type of relationship from another? To answer the first question, I further analyzed the data: I looked for the variables, among those used to capture the external market and technology environment of each relationship, that displayed significant differences across the four cells. I discovered, for instance, that the average product complexity of the components belonging to the market-exchange cell is significantly lower than the average product complexity of those belonging to the other three cells. In the final analysis, the four cells differ along three sets of contextual factors: (1) the characteristics of the product exchanged and its underlying technology, (2) the level of competition in the upstream market, and (3) the capabilities of the suppliers available in the marketplace (see Figure 2).
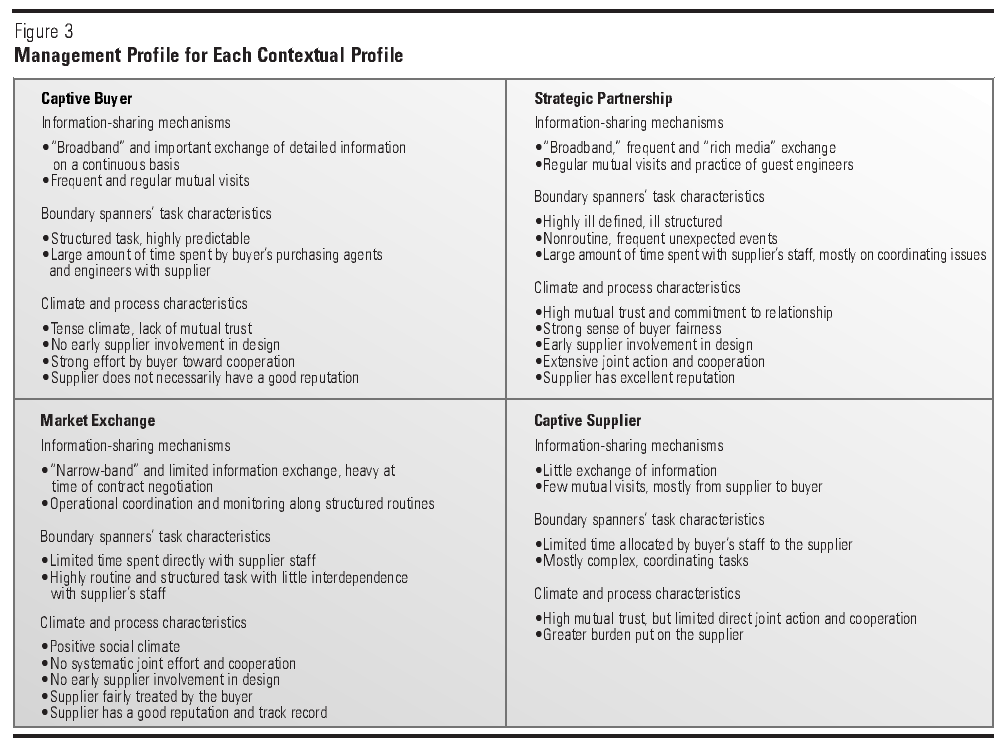
To answer the second question, I proceeded differently. I split each cell into high-performing and the low-performing relationships and then used the same procedure to look for the variables describing the internal workings of each relationship that display a difference between the two performance subgroups. For instance, successful relationships within the strategic partnership cell exhibit a high level of mutual trust, early supplier involvement in design, extensive cooperation, and a high level of information exchange (hence the label). These management variables can be classified into three generic dimensions: (1) information-sharing practices, (2) characteristics of boundary spanners’ jobs, and (3) the social climate within the relationship (see Figure 3). The findings suggest that components having similar characteristics in terms of their underlying technology (e.g., based on a mature or a new technology), their architectural design (e.g., complex designs), and the market structure (e.g., concentration in the upstream market) tend to be managed the same way.5
Contextual Profiles
The following profiles describe the product and market conditions under which each type of relationship is likely to appear.
Market-Exchange Profile
U.S. and Japanese firms typically use market-exchange relationships for highly standardized products (see Figure 2). These are products that require little or no customization to the automaker’s final product, for example, standard bearings or relays. They are based on a simple, mature technology that requires little engineering effort and expertise from suppliers. Although a few technically complex components exist in this cluster, their design process is stable and well structured, and their manufacturing process is well established. Market-exchange relationships also appear appropriate for products not subject to major technological innovation or frequent design changes. U.S. and Japanese buyers treat these products as commodities and systematically outsource their manufacture.
The data indicate that manufacturers can easily find many suppliers capable of engineering, manufacturing, and delivering this kind of product. This is a business that requires little capital investment and few innovation capabilities. The upstream market is therefore highly competitive, with many small, independent “mom and pop” shops competing for a stable, saturated, and even declining market. These small firms rely heavily on the auto industry and do business with most, if not all, car companies. Suppliers can also easily and cheaply find and shift their production from one customer to another, thus benefiting from low switching costs. They do not have any proprietary technology embedded in their product or manufacturing process.
For example, in both countries, for commodity-like products such as standard fasteners or ornamentation, the primary goal of manufacturers is to minimize cost and leverage economies of scale through large volumes relying on a number of suppliers. Nearby mom-and-pop shops are ready to make price concessions. They usually get repeat business despite short-term contracts. Furthermore, these relationships can be positive and collaborative (within the narrow scope of straightforward transactions), without at the same time being a strategic partnership; that is, the partners make no long-term commitments and can easily find an alternative supplier or customer. As noted earlier, many Japanese firms are engaged in these kinds of relationships.6
Captive-Buyer Profile
The main difference between captive-buyer and market-exchange relationships lies more in the characteristics of the upstream market and the kind of suppliers available than in the characteristics of the product (see Figure 2). I found captive-buyer relationships for bearings, bumper fascia, beams, and glass products. These relationships involve complex components that require some customization but that are still based on a well-understood, stable technology.
Engineers surveyed in both countries do not anticipate major product, process, or even price/performance improvements in the next five years for this kind of product. In addition, they report stable demand and limited market growth. The supply market is highly concentrated, with a few large, well-established players. Incumbents typically possess a proprietary technology and/or benefit from a strong bargaining power over car companies. Should these companies terminate the contract, they would find it difficult and costly to locate and shift to another source of supply. To compensate for their heavy economic and technological reliance on the supplier’s business, both U.S. and Japanese automakers keep some in-house manufacturing capability for the products involved.
Strategic Partnership Profile
The relationships in the strategic partnership cell involve highly customized components or integrated subsystems that require strong technology and engineering capabilities (see Figure 2). The technical complexity of these subsystems affects and runs across the multiple stages of the value chain —from the concept design to the development of tooling and manufacturing processes by both the buyer and the supplier to the coordination of just-in-time production and delivery between the two firms. The automaker by definition has made important investments in the relationship, tying critical internal assets to the supplier and thereby increasing the potential risk and damage if the supplier behaves opportunistically.
The upstream market is high growth but extremely competitive, with great uncertainty about the choice of the right technology or standard, as innovation leaps and frequent technical changes tend to disturb industry structure. Partners involved in a strategic partnership therefore choose to “tie each other’s hands” and develop a close, long-term relationship. Suppliers, mostly large firms with a broad range of product offerings, have developed design and production skills and capabilities tailored to the buyer’s business. Toyota’s strategic partners build plants or warehouses only thirty miles away on average from the final assembly plants.7 The two partners perceive their economic fates as closely linked. In addition, to keep up with the fast pace of innovation and maintain their proprietary technology, suppliers invest heavily in fundamental research (in some cases, jointly with the automaker) in addition to the usual joint investments in new product or process development. In both countries, automakers usually keep an in-house design, development, testing, and, sometimes, manufacturing capability for these technologies.
Strategic partnerships are formed for such products as power steering, suspension, breaking, and air-conditioning systems. A high level of interaction and interdependency (for example, during design, manufacturing, and even operation) exists between these systems and the rest of the vehicle. Competition in the automobile business is increasingly waged in the technology and design of these core systems.
Captive-Supplier Profile
Captive-supplier relationships involve highly complex products based on a new technology typically developed and owned by the supplier (see Figure 2). Usually integrated subsystems, these products require heavy capital investments from the supplier just to stay in the market and to maintain its strong design reputation and superior engineering and manufacturing capabilities. These products and their underlying technology are in high demand, but car companies seem to shift suppliers quickly as the technology evolves and other players offer improvements in functionality and product performance. Hence, despite their proprietary technology, suppliers have limited bargaining power. Other suppliers, among the few qualified ones, would readily make the specialized investments requested by the customer to get a share of the business.
The upstream market appears fiercely competitive and heavily reliant on the automotive sector. In Japan, for example, contrary to popular belief, auto manufacturers typically use up to four capable suppliers to procure the same high-value component. One company in the sample kept three firms as its primary source for instrument panels and dashboards. Each supplier has a promise of repeat business; that is, a base contract that stipulates that unless something adverse happens, the relationship will continue, which provides the three suppliers with sufficient incentives to take a longer-term view and make investments in R&D or process technology to add value for the customer. The assembler, on the other hand, keeps these three suppliers “on their toes” as it moves 4 percent to 5 percent of its annual volume from one to another each time it identifies a deficiency in quality or delivery reliability.
Management Profiles
The following profiles describe the common management features of the best performers in each cell. As explained earlier, I looked for differences in manage- ment practices between the low and high performers in each cell (see Figure 3).
Market-Exchange Management
In high-performing market-exchange relationships, information exchange between two firms takes place mainly during bidding and contract negotiations. Suppliers do not get involved in the design of the component and usually manufacture to the buyer’s specifications. The operational coordination of delivery and inventory as well as the monitoring of quality are executed using proven organizational routines. Mizumi, for example, the second-largest Japanese provider of metal molds, has few salespeople. Originally distributing its products by catalogue, it has dramatically increased the number of orders executed through electronic data interchange.
Boundary spanners, or purchasing agents and engineers, report spending a limited amount of their total time with the supplier staff. They rarely visit the supplier’s premises, except when urgent and exceptional operational problems occur. They perceive their tasks as highly routine and structured; their individual performance does not depend on the effective performance of supplier staff. Although mutual trust, cooperation, and systematic joint effort are typically absent from these relationships, the social climate is generally positive. Automakers seem to treat these suppliers fairly, reasonably sharing the benefits, burdens, and risks in the relationship within the limits of the contract. Suppliers have a good reputation for holding to their commitments and show a track record that satisfies the automaker. While some market-exchange relationships in the data set were based on a formal short-term contract, they had actually lasted for thirty years with intermittent periods of no business together.
Captive-Buyer Management
Despite the need for customization, operational coordination between buyer and supplier is broken down into manageable, well-understood steps and procedures. In addition, the complexity of the product requires the exchange of detailed information on a continuous basis, justifying the high level of communication that takes place in successful captive-buyer relationships in both countries. Indeed, multiple functional areas such as design, manufacturing, quality, and purchasing or sales work together across two firms, establishing a “broadband” communication channel that contrasts with the “narrow-band” channel in market-exchange relationships. Boundary spanners see their tasks as structured and highly predictable, but acknowledge spending a large amount of their time dealing with the supplier. The social climate is typically tense, even in successful relationships. Respondents in both countries report mutual distrust; suppliers have a poor reputation and a negative track record despite automakers’ efforts to cooperate and provide suppliers with technical assistance, training, and education.
Strategic Partnership Management
In these close relationships, the two partners exchange information regularly, through reports, standardized rules and operating procedures, electronic transfer of schedules, and face-to-face contact. Engineers from the supplier firm pay frequent visits to the assembler’s engineering facilities, purchasing headquarters, and assembly plants. Guest engineers often reside at the manufacturer’s premises or are integral members of the team involved in the design of a major system. In addition, buyers exchange data with suppliers in a form directly readable by a computer either by exchanging magnetic tapes or discs (primarily in Japan) or by sending data from one computer to another by modem or telecommunication links (primarily in the United States). Firms use electronic data interchange across multiple functional areas: purchasing (e.g., request for quotes, purchase orders), engineering (e.g., paper drawings, CAD/CAM file transfer, or three-dimensional wireframe), and quality and production control.
The fast pace of change in technology and product design makes it difficult to forecast and plan; moreover, any decision can quickly become obsolete and irrelevant. U.S. and Japanese boundary spanners in strategic partnerships thus view their jobs as being nonroutine, ill defined, and ill structured. They spend a large amount of time with the supplier staff, engaged in coordinating tasks (e.g., exchanging ideas about future plans and improvements) as opposed to control tasks (e.g., negotiating contracts and monitoring supplier performance).
The social climate in strategic partnerships is reportedly trusting and collaborative.8 The manufacturer displays a high commitment to the relationship and is willing to engage in joint action with the supplier. For example, assemblers often get suppliers involved in the early stages of the component design and cooperate with them in long-range planning; advanced research; product, process, and tooling development; technical assistance; and training and education. At the same time, however, tensions between buyer and supplier often arise over component pricing, cost structure (and contribution to lowering cost over time), product design, quality levels, and inventory and delivery policies. These disagreements are usually resolved through collaborative processes rather than through confrontation. In these relationships, as in some market-exchange relationships, there is a strong sense of sharing the benefits, burdens, and risks.
Captive-Supplier Management
Compared with the other three clusters, captive-supplier relationships involve a lower level of information exchange. Communication focuses on complex coordinating tasks rather than the control activities associated with market-exchange relationships. Boundary spanners spend less time on tasks such as negotiating the contract and monitoring the supplier. Who pays more visits? Clearly, the burden rests on the supplier. The social climate of the relationship is one of high mutual trust, although that trust does not necessarily translate into active joint planning or development as in strategic partnerships.
Paths to Success and Failure
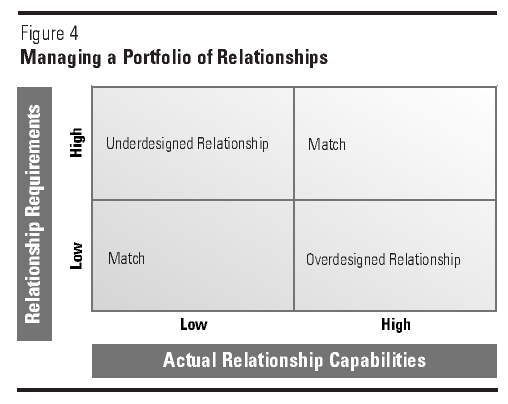
What do we learn by integrating the contextual and managerial profiles? Figure 3 shows the managerial practices that high performers in each cell use to match the coordination, information, and knowledge-exchange requirements presented by the external context depicted in Figure 2. Structured routines and “narrow-band” information exchange, for instance, are sufficient to coordinate efficiently in the case of standardized products based on a mature technology. Managers can use a simple framework to compare the coordination, information, and knowledge-exchange capabilities of their actual relationships (or future plans) against the relationship requirements determined by the product and its market (see Figure 4).
There are two kinds of successful relationships: high requirements-high capabilities and low requirements-low capabilities. There are also two paths to failure: underdesigned relationships and overdesigned relationships. For example, firms that invest in building trust through frequent visits, guest engineers, and cross-company teams when the product and market context calls for simple, impersonal control and data-exchange mechanisms are overdesigning the relationship. This path is not only costly but also risky, given the specialized investments involved, in particular, the intangible ones (e.g., people, information, or knowledge).
Designing or redesigning relationships consists of three analytical steps: (1) the strategic selection of relational types to match the external conditions given by the product, the technology, and the market (Figure 2); (2) the identification of an appropriate management profile for each type of relational design (Figure 3); and (3) matching the design of the relationship, which could be over- or underdesigned, to the desired management profile (Figure 4).
Conclusion
Contrary to myth, empirical study shows that the supply-chain decisions and behavior of Japanese firms converge with those of their U.S. counterparts. Firms in both countries manage a portfolio of rela- ionships. Indeed, research highlights the existence of a large proportion of market-exchange relationships in Japan and of strategic partnerships in the United States. In other words, good practice in both countries means, first, properly balancing a portfolio of relationships adapted to product and market conditions and, second, managing each type of relationship effectively. To help managers avoid the traps of underdesigning some relationships (the problem of the 1980s) and overdesigning others (the risk for the future), I offer a contextual profile to show when one type of relationship is more likely than another and propose three key environmental factors to consider: (1) the product exchanged and its technology, (2) the competitive conditions in the upstream market, and (3) the capabilities of the suppliers available. Finally, I suggest a management profile for each type of relationship along three mechanisms that contribute to coordination and information and knowledge exchange: (1) information sharing, (2) boundary spanners’ job characteristics, and (3) the social climate of the relationship.
Many large firms, especially in manufacturing, are streamlining their operations, typically moving away from traditional vertical integration toward more external contracting of key activities. As these inter-firm relationships increase in number and variety, organizations cannot manage with only one design for all relationships. They need to manage a portfolio of relationships. I offer a two-step framework to help senior executives, first, identify which type of relationship matches the competitive conditions surrounding the product or service exchanged and, second, design the appropriate management model for each type of relationship. As they consciously and systematically match the design of each relationship to its external context, product executives can control the sweeping fad for “strategic partnerships” and avoid the two common traps of underdesigning and overdesigning external relationships.
References
1. M. Cusumano and A. Takeishi, “Supplier Relations and Management: A Survey of Japanese, Japanese-Transplant, and U.S. Auto Plants,” Strategic Management Journal, volume 12, November 1991, pp. 563-588;
J.H. Dyer and W.G. Ouchi, “Japanese-Style Business Partnerships: Giving Companies a Competitive Edge,” Sloan Management Review, volume 35, Fall 1993, pp. 51-63;
S. Helper and M. Sako, “Supplier Relations in Japan and the United States: Are They Converging?” Sloan Management Review, volume 36, Spring 1995, pp. 77-84;
T. Nishiguchi, Strategic Industrial Sourcing: The Japanese Advantage (Oxford: Oxford University Press, 1992); and
M. Smitka, Competitive Ties: Subcontracting in the Japanese Automotive Industry (New York: Columbia University Press, 1991).
2. For information on the research project, see:
M. Bensaou and N. Venkatraman, “Configurations of Interorganizational Relationships: A Comparison between U.S. and Japanese Automakers,” Management Science, volume 41, number 9, 1995, pp. 1471–1492; and
M. Bensaou, “Interorganizational Cooperation: The Role of Information Technology. An Empirical Comparison of U.S. and Japanese Supplier Relations,” Information Systems Research, volume 8, number 2, 1997, pp. 107–124.
In the data-collection process, sampling followed the same procedure in all three U.S. and eleven Japanese car companies. Senior managers at the central division or platform level were asked to select a set of car components under their responsibility from the stratified list of fifty components prepared by the researcher (i.e., to prevent selection bias). For each of the selected components, they helped identify the individual purchasing agents and/or engineers to whom I could send the questionnaire. The final decision about which specific supplier (the respondent’s name and the name of the supplier were not asked) and which part number to choose was at the respondent’s discretion. The data were collected in 1991 with a 43 percent total response rate; n = 140 in the United States and n = 307 in Japan.
3. For instance, “buyer’s asset specificity” is significantly correlated:
at the .40 level (p < .001) with an 8-item scale of cooperation between buyer and supplier;
at the .10 level (p < .05) with the scope of the relationship, i.e., the number of products provided by the supplier;
at the .16 level (p < .01) with a 3-item scale of the level of trust;
at the .22 level (p < .001) with the extent to which the benefits, burden, and risks are perceived to be shared fairly within the relationship;
at the .18 level (p < .001) with the expectation of continuity of the relationship in the long term;
at the .25 level (p < .001) with the extent of visits exchanged between the two parties.
4. J.H. Dyer, “Specialized Supplier Networks as a Source of Competitive Advantage: Evidence from the Auto Industry,” Strategic Management Journal, volume 17, April 1996, pp. 271–291;
and J.H. Dyer, “Dedicated Assets: Japan’s Manufacturing Edge,” Harvard Business Review, volume 72, November-December 1994, pp. 174–178.
Dyer (1996) has empirically shown the link between asset specificity and performance and has described suppliers’ dedicated assets as the source of Japanese manufacturers’ superior performance and the foundation of their close relationship with their network of suppliers. “Most competitors know that a key to the success of Japanese network relationships is the practice of dedicating supplier assets to the customer.” Dyer (1994), p. 174.
5. The structure of the various component markets (as well as the car market) differs across the United States and Japan, even for similar components. Similarly, the commercial and competitive availability of similar technologies may vary across the two national markets. The data I collected consist of relationships only between U.S. automakers and their U.S. suppliers within the U.S. market and relationships between Japanese automakers and their Japanese suppliers within the Japanese market. In addition, these external contingencies may vary over time, e.g., the entry of Japanese and European automakers starting in the 1970s. See:
S. Helper, “Strategy and Irreversibility in Supplier Relations: The Case of the U.S. Automobile Industry,” Business History Review, volume 65, Winter 1991, pp. 781–824.
6. See K. Sakai, “The Feudal World of Japanese Manufacturing,” Harvard Business Review, volume 68, November–December 1990, pp. 38–49.
7. See Dyer (1994).
8. In this article, I suggest that these practices, such as trust, fairness, and extensive cooperation are characteristics of well-performing strategic partnerships more than characteristics of Japanese supplier relations. The national differences are reflected in the frequency of each type of relationship in each country.