Which Innovation Efforts Will Pay?
For many companies, developing new products is a hit-or-miss proposition. Some businesses with successful innovation practices are relying on a new analytic tool to ensure that the hits are much more likely.
Topics

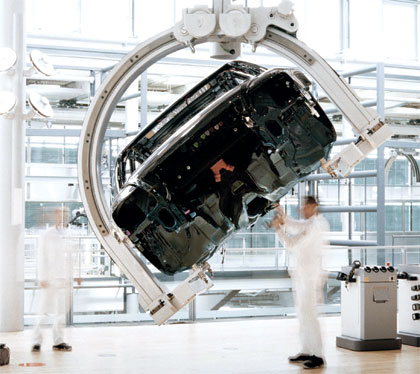
Courtesy of Volkswagen
Successful innovation — the kind that leads to customer engagement and profits — is rare and hard to achieve, or so one might conclude from observing the results of many companies’ innovation efforts. Some have tried investing intensively in research and development. But a recent Booz & Co. study of public companies representing almost 60% of global R&D expenditures found that above a certain minimal level, there is generally no correlation between R&D spending and financial metrics such as sales or profit growth.1 Some have tried to follow prevailing trends such as open innovation — but that, too, doesn’t necessarily lead to higher innovation returns.2 Many pursue a strategy of tacit benchmarking: They invest near the average amount of R&D spending for their industries, while running development shops that use many of their peers’ best practices. That approach, over time, has led to greater numbers of minor product line extensions with often diminishing returns.
Yet some companies seem to be better at dreaming up great new products while spending less to do it. Apple Inc. commits 5.9% of sales to R&D, less than its industry’s average of 7.6%. The R&D budgets for two of Detroit’s beleaguered Big Three have been consistently higher than that of Toyota Motor Corp., at least until 2008. Where innovation investment is concerned, the key question is not how much to spend but how to spend it.
Return on Innovation Investment
It’s easy to conclude from this track record that innovation success depends on mysterious factors, part science and part magic, rather than business acumen. But there are companies that overcome these hurdles and regularly produce high-yield innovations. Examples include companies as disparate as Cisco Systems, Tata Sons, Campbell’s Soup and Volkswagen. Because these companies (and other successful innovators) are so diverse and the factors that distinguish them have been obscure, my colleagues and I have looked for a reliable analytic tool that can help explain why some innovations succeed and others fail. We believe we have found one with the return on innovation investment or ROI2 methodology.
References (7)
1. B. Jaruzelski, K. Dehoff and R. Bordia, “Money Isn’t Everything: The Global Innovation 1000,” Strategy + Business (winter 2005). Also see G. McWilliams, “In R&D, Brains Beat Spending in Boosting Profits,” Wall Street Journal, Oct. 11, 2005, sec. A, pp. 2, 13: “The finding flies in the face of academic studies and accepted wisdom on the value of corporate research.”
2. See R.M. Kanter, “Innovation: The Classic Traps,” Harvard Business Review 84 (November 2006): 73-83. Kanter writes, “Too often … grand declarations about innovation are followed by mediocre execution that produces anemic results.” A similar point is made in T. A. Stewart, “The Great Wheel of Innovation,” Harvard Business Review 84 (November 2006): 14: “Companies have been rushing to find new ways to make old mistakes.” (Approximately the same number of scholarly articles with “innovation” in the title were published in 2007 as during the entire decade of the 1980s.)


Comments (3)
ghocker
Anonymous
navindu