Listening to the Customer — The Concept of a Service-Quality Information System

Reading Time: 24 min 

Topics

Permissions and PDF Download

The quality of listening has an impact on the quality of service. Firms intent on improving service need to listen continuously to three types of customers: external customers who have experienced the firm’s service; competitors’ customers who the firm would like to make its own; and internal customers (employees) who depend on internal services to provide their own services. Without the voices of these groups guiding investment in service improvement, all companies can hope for are marginal gains.

In this paper, we discuss the concept of a service-quality information system. We argue that companies need to establish ongoing listening systems using multiple methods among different customer groups. A single service-quality study is a snapshot taken at a point in time and from a particular angle. Deeper insight and more informed decision making come from a continuing series of snapshots taken from various angles and through different lenses, which form the essence of systematic listening.

Systematic Listening

A service-quality information system uses multiple research approaches to systematically capture, organize, and disseminate service-quality information to support decision making. Continuously generated data flow into databases that decision makers can use on both a regularly scheduled and as-needed basis.

The use of multiple research approaches is necessary because each approach has limitations as well as strengths. Combining approaches enables a firm to tap the strengths of each and compensate for weaknesses. Continuous data collection and dissemination informs and educates decision makers about the patterns of change — for example, customers’ shifting service priorities and declining or improving performance in the company’s or the competitors’ service.

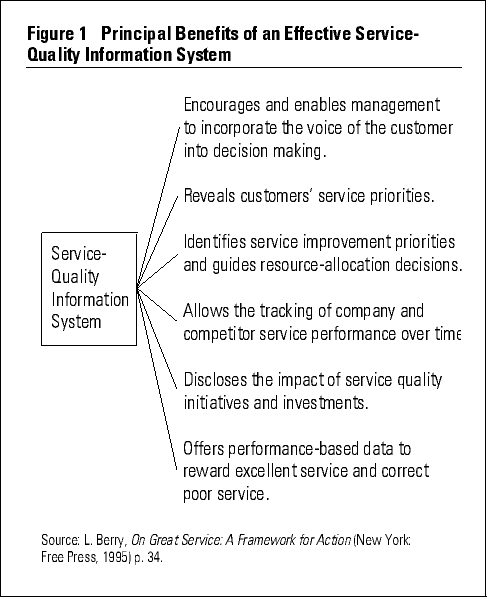
An effective service-quality information system offers a company’s executives a larger view of service quality along with a composite of many smaller pictures. It teaches decision makers which service attributes are important to customers and prospects, what parts of the firm’s service system are working well or breaking down, and which service investments are paying off. A service-quality information system helps to focus service improvement planning and resource allocation. It can help sustain managers’ motivation for service improvement by comparing the service performance of various units in the organization and linking compensation to these results. And it can be the basis for an effective first-line employee reward system by identifying the most effective service providers. (See Figure 1 for the principal benefits of a service-quality information system.)

The task of improving service in organizations is complex. It involves knowing what to do on multiple fronts, such as technology, service systems, employee selection, training and education, and reward systems. It involves knowing when to take these initiatives. It involves knowing how to implement these actions and how to transform activity into sustainable improvement. Genuine service improvement requires an integrated strategy based on systematic listening. Unrelated, incomplete studies, outdated research, and findings about customers that are not shared provide insufficient support for improving service.

Approaches to Service Research

A company can choose from many possible research approaches to build a service-quality information system (see Table 1). A firm would not use all approaches in the table in the same system; too much information obscures the most meaningful insights and may intimidate intended users. Conversely, incomplete information injects needless guessing into decision making or, worse, paints a false picture. The nature of the service, the firm’s service strategy, and the needs of the information users determine which service-quality research approaches to use.

An industrial equipment manufacturer might wish to use service reviews to benefit from unfiltered dialogue with multiple users, reach consensus on service support priorities, and solidify relationships. A restaurant, with a transaction-oriented business, would find service reviews far less efficient than other approaches. Because of the relationship nature of its business, a limousine service should consider new, declining, and lost-customer surveys. It should identify any negatives that tarnish new customers’ first impressions, or cause other customers to be less loyal or to defect, so it can take corrective measures. A taxi company probably wouldn’t use these surveys because of a minimal relationship-marketing potential. A firm whose strategy emphasizes service reliability surely would want to capture and analyze customer service complaints to identify where the service system is breaking down. A company whose strategy depends on point-of-sale service excellence should consider mystery shopping research, which generates feedback on specific service providers.

Four research approaches summarized in the table apply to virtually all organizations and can be considered essential components of a service-quality information system: transactional surveys; customer complaint, comment, and inquiry capture; total market surveys; and employee surveys. These approaches ensure coverage of the three customer types (external customers, competitors’ customers, internal customers), document failure-prone parts of the service system, and provide both transaction-specific and overall service feedback.

Personal Involvement in Listening

A service-quality information system does not replace the need for managers to interact directly with customers. Becoming well informed about service quality requires more than reading or hearing the results of structured, quantitative studies. It also requires that decision makers become personally involved in listening to the voices of their customers, which can include participating in or observing qualitative research, such as service reviews and focus groups. And it can include less formal interactions with customers, such as when airline executives query passengers on flights and retailers accompany customers through their stores to ask them what they see, like, and dislike.

In 1993, the cash management division of First National Bank of Chicago changed its customer satisfaction surveys from mail questionnaires to telephone interviews. The change was prompted by poor response rates to the mail survey and customers’ suggestions for improving survey effectiveness: conduct the surveys by phone because they are more efficient and have bank employees who can act on problems make the calls.

First Chicago recruited senior and middle managers to conduct three prescheduled twenty-minute phone interviews per month and write reports on each call for the database. Managers were trained to do the interviews and passed a certification test before surveying their first customer. They surveyed each employee of the client firm who had significant contact with the bank. Bank managers were responsible for “action items” that surfaced in the interviews. The bank’s vice president of quality assurance, Aleta Holub, remarked, “We’ve really seen a cultural change from getting everyone a little closer to the customer.”1

Directly hearing the voices of customers, noncustomers, and employees adds richness, meaning, and perspective to the interpretation of quantitative data. The First Chicago case illustrates the potential impact embedded in literally hearing the customer’s voice, rather than hearing only a distilled or numeric representation of it. McQuarrie makes the point: “Everyone believes his or her own eyes and ears first. Key players hear about problems and needs directly from the most credible source — the customer. Learning is enhanced because of the vivid and compelling quality of first-hand knowledge.”2

A well-designed and -implemented service-quality information system raises the probability that a company will invest service improvement money in ways that actually improve service. It also continually underscores the need to improve service. Continually capturing and disseminating data reveal not only progress, but problems; not only strengths, but weaknesses. Quality service is a never-ending journey. An effective service-quality information system reminds everyone that more work needs to be done.

Developing an Effective Service-Quality Information System

The primary test of a service-quality information system is the extent to which it informs and guides service-improvement decision making. Another important test is the extent to which the system motivates both managerial and nonmanagerial employees to improve service. There are five guidelines for developing a system that can meet these tests:

  1. Measure service expectations.
  2. Emphasize information quality.
  3. Capture customers’ words.
  4. Link service performance to business results.
  5. Reach every employee.

The core success factors embedded are the coverage of external, competitors,’ and internal customers; the use of multiple measures; and ongoing measurement.

Measure Service Expectations

Measuring service performance per se is not as meaningful as measuring performance relative to customers’ expectations. Customers’ service expectations provide a frame of reference for their assessment of the service. Assume, for example, that a company measures only customers’ perceptions of service performance using a 9-point scale. It receives an average perception score of 7.3 on the service attribute “Performs the service right the first time.” How should managers interpret this score? Is it a good score? Without knowing what customers expect, this is a difficult question. There is no basis for gauging the rating. Managers’ interpretation of the 7.3 perception score would likely be far different if customers’ average expectation rating for this attribute were 8.2 rather than 7.0. As researchers Goodman et al. ask: “How satisfied is a satisfied customer? When is good, good enough? Unfortunately, companies that ask their customers how satisfied they are but fail to research customers’ expectations cannot answer these questions.”3

We collected service quality data from a computer manufacturer’s customers (see Figure 2). We measured two levels of expectations: desired service (what the customer believes the service should be and can be) and adequate service (the minimal level of service acceptable to the customer). The top of the tolerance zone represents customers’ average desired service-expectation score, the bottom, their average adequate service-expectation score. Service performance is superior if perception scores exceed the zone of tolerance, acceptable if perceptions are within the zone, and unacceptable if perceptions are below the zone.

Comparing the perceptions-only data with the combined perceptions-expectations data demonstrates the diagnostic value of measuring customers’ expectations. Were the computer manufacturer to measure only customer perceptions, its management would have little guidance for investing service improvement resources. The perception scores are similar across the service dimensions. However, the inclusion of expectations data clearly shows that improving service reliability should take priority over improving tangibles. Although reliability and tangibles have identical perception scores, customers’ expectations for reliable service are much higher. Whereas customers’ perceptions barely exceed adequate-level expectations for reliability, they exceed desired-level expectations for tangibles.

We also contrasted perceptions-only and perceptions-expectations data for a retail chain (see Figure 3). Without expectations data, management may conclude that the firm’s service quality is acceptable because all perception scores are more than a full point above the scale’s midpoint of 5. However, the addition of expectations scores suggests a much different conclusion, with service performance on four of the five dimensions not even meeting customers’ minimum expectations.4

Documenting the value of measuring customer expectations in service quality research is necessary because perceptions-only research is common. Measuring expectations adds complexity and possibly length to the survey process and can be more expensive. Moreover, accurately measuring expectations is not easy. The best way to do it and whether it is even necessary are the subject of debate.5 Advocates of perceptions-only measurement typically point out that service perception scores explain more variance in an overall service quality measure than a combined expectations-perceptions measure. Perceptions ratings consistently explain more variance, most likely because pieces of the whole (perceptions of specific service attributes) are being regressed against the whole (an overall service perception measure). So why is it so critical to measure customer expectations of service? Because, as Figures 2 and 3 show, managers learn more about improving service when customer expectations provide a frame of reference for interpreting perception ratings.

Emphasize Information Quality

Quality of information — not quantity — is the objective in building a service-quality information system. The test of information quality is to ask if the information is:

  • Relevant?
  • Precise?
  • Useful?
  • In context?
  • Credible?
  • Understandable?.
  • Timely?

Relevant service-quality information focuses decision makers’ attention on the most important issues to meet and exceed external customer expectations, convert prospects, and enable employees to improve service. The more a service-quality information system focuses on the service priorities of the three customer types, the more likely managers will invest in the most appropriate initiatives that can make a positive difference.

Measuring the importance of service attributes is not the same as measuring customers’ service expectations, although they are closely related. Customers’ expectations are the comparison standards they use to judge the performance of various service attributes. However, the service attributes are not uniformly important to customers, and it is necessary to specifically measure their relative importance to monitor company and competitor performance on those attributes that drive customers’ overall perceptions of service quality.

Information precision and usefulness go hand in hand. Information that is overly broad or general is not useful. Researcher Brian Lunde commented: “One of the worst criticisms that could be made by a line manager about a company’s . . . information is that it is ‘interesting.’ ‘Interesting’ is code for ‘useless.’ The information simply must be specific enough that executives . . . can take action — make decisions, set priorities, launch programs, cancel projects.”6

Information on what must be done to improve service is useful. Chase Manhattan Bank has determined empirically that the approval process is the primary driver of customers’ quality perceptions for its mortgage loan service. Accordingly, Chase’s service information system tracks its performance on the mortgage approval process compared to its principal competitors. However, Chase does not stop with overall perceptions of the mortgage approval process. It also investigates “sub-drivers” such as quick approval, communication, the appraisal process, amount of paperwork, and unchanging loan amount. The information is sufficiently precise so managers know what to do and can assign implementation accountabilities. They review data patterns regularly at management meetings.7

An effective service-quality information system presents information dynamically. At any point in time, the system’s output tells what is becoming more or less important — the context. Fresh data are more valuable when presented in the context of past data. The study of trend data reveals patterns, nuances, and insights that one-time data cannot possibly reveal. Is the investment in new telephone technology paying off? Was it a good idea to redesign the account-opening procedures? Is the company’s new investment in training reducing error rates? Has competitor advertising about service influenced customer expectations? Has the competitor’s new store prototype given its service ratings a boost? Only trend data can answer these and myriad other questions. Ongoing research using common measures across study periods generates trend data that provide context and aid interpretation.

A service-quality information system will not motivate managerial and nonmanagerial employees unless the information is credible. Employees in low-rated units may be embarrassed and financially hurt by the system’s output and may question the information’s validity. Companies can improve information credibility by seeking input from operating units on the design of research approaches and the development of specific questions. Information sessions to explain research approaches to employees, with an opportunity for questions and answers, also can be useful. Clear explanations of the research method and sample size should accompany the dissemination of results. Multiple measures — a fundamental tenet of service-quality information systems — enhance information credibility when different measures point to similar conclusions. The use of an outside research firm for data collection can help convey impartiality.

Information quality also is determined by whether the information is understandable to intended users. Relevance, usefulness, and credibility all are enhanced with easily understood research information. Unfamiliar statistical jargon and symbols confuse, intimidate, and discourage users, leading to feigned use of the system and incorrect interpretations of its output. There should be a concerted effort to design a user-friendly system with uniform reports and clear presentation of data.

The timeliness of information influences its quality. All the other attributes of information quality are rendered impotent if information is not available when decision makers need it. Companies should collect data to support their natural decision making and planning cycles. Monthly transactional survey reports should be ready for the monthly management meeting, total market survey results should feed the annual planning and budgeting process, customer complaint analyses should be ready for the twice-a-month meetings of the service-improvement leadership team. The design of databases should accommodate trend-data retrieval for managers as needed. Companies should continually explore ways to accelerate data collection and dissemination. Firms might fax or e-mail questionnaires to respondents rather than use the postal service. Research results might be distributed internally on a company’s intranet.

The information quality tests of relevance, precision, usefulness, context, credibility, understandability, and timeliness are not absolutes. Improving information quality is a journey of trial and error, experience curve effects, user feedback, and new knowledge. Building an effective system is a never-ending process of refinement. Larry Brandt, associate director of customer service at AMP, a manufacturer of electrical and electronic connectors, points out the necessity of continuous improvement: “We need to constantly evaluate what it is we’re measuring, why we’re doing it, and whether the results are worthwhile in the organization’s big picture, or we run the risk of wasting time and effort.”8

Capture Customers’ Words

The best service-quality information systems are built with qualitative and quantitative databases, rather than strictly the latter. Quantified data are summaries; averages of customers’ perceptions of a very specific service issue are still averages. Quantitative data bring many benefits to the service information table, including easy analysis, comparability from one period to the next, and potential projectability. What numbers don’t offer are the tone, inflection, feeling, and “word pictures” from customers’ voices. A service quality report showing that 4 percent of the customer base is very dissatisfied and another 13 percent is somewhat dissatisfied with the company’s service may not get management’s attention. However, if the report includes customers’ verbatim comments, it may receive a very different reaction.

GTE Supply and Lexus customers illustrate the importance of capturing customers’ words. GTE Supply purchases numerous products needed for the telephone operations of its customers, the local telephone companies. By implementing a systematic survey of customers’ needs and opinions, GTE has improved service quality. The survey generates both quantitative and qualitative data for each customer. Current numerical quality ratings are compared to previous results to spot problems. In addition, the survey asks two open-ended questions: “Why do you say that?” (in response to a closed-ended overall quality question) and “What improvements, if any, could be made by Supply?” The company enters the customers’ own words into a database and presents them to its managers along with the numerical data. GTE researchers James Drew and Tye Fussell remarked: “Tabulations of survey questions can highlight specific transaction characteristics in need of improvement from the customer’s viewpoint. In contrast, open-ended comments are especially effective in motivating first-level managers and giving the tabulations substance and a human touch.”9

Toyota introduced the Lexus line of luxury cars in the late 1980s, and by the early 1990s, the cars had vaulted to the top of the J.D. Power & Associates ratings in customer satisfaction. Soon after, another luxury carmaker retained Custom Research Inc. (CRI), a marketing research firm, to find out why Lexus owners were so satisfied. CRI conducted a series of focus groups to hear the Lexus story in the owners’ words. Most of the Lexus drivers eagerly volunteered stories about the special care and attention they had received from their Lexus dealer. It became clear that although Lexus was manufacturing cars with few mechanical problems, the extra care shown in the sales and service process strongly influenced buyer satisfaction. Owners felt pampered and respected as valued Lexus customers. For example, one female owner mentioned several times during the focus group that she had never had a problem with her Lexus. However, on further probing, she said, “Well, I suppose you could call the four times they had to replace the windshield a ‘problem.’ But frankly, they took care of it so well and always gave me a loaner car, so I never really considered it a ‘problem’ until you mentioned it now.” CRI’s research showed that the Lexus policy of always offering service customers a loaner car took almost all the pain out of the service experience. These insights from the focus groups helped explain the reasons behind the high J.D. Power satisfaction scores. And they gave CRI’s client a view of the Lexus ownership experience not evident from the scores alone.

When customers express their views on videotape, the effect is even more compelling than printed verbatim comments. For company personnel, nothing beats seeing the intensity of customers’ comments. Southwest Airlines shows contact employees videotapes of passengers complaining about service. Colleen Barrett, executive vice president for customers, states: “When we show the tape, you can hear a pin drop. It’s fascinating to see the faces of employees while they’re watching. When they realize the customer is talking about them, it’s pretty chilling. That has far more impact than anything I can say.”10

During the past few years, Levi Strauss & Co., one of the world’s most successful companies, has been completely transforming its business processes, systems, and facilities. Improving the speed and reliability of distribution has been its principal objective. The team leading the transformation used videotaped interviews with customers to help convince the employees in such a successful company that change was essential. One big customer said, “We trust many of your competitors implicitly. We sample their deliveries. We open all Levi’s deliveries.” Another customer stated, “Your lead times are the worst. If you weren’t Levi’s, you’d be gone.”11

Companies investing in service-quality information systems should consider using what McQuarrie calls “perennial questions.”12 A perennial question is open-ended and allows customers to speak directly about what concerns them most. Companies should ask it consistently and save responses in a database to ascertain data patterns. GTE Supply’s question, “What improvements, if any, could be made by Supply?” is a perennial question. McQuarrie offers this example: “What things do we do particularly well or particularly poorly, relative to our competitors?” Examples of perennial questions directed to employees include:

  • What is the biggest problem you face every day trying to deliver high-quality service to your customers?
  • If you were president of the company and could make only one change to improve service quality, what change would you make?13

Combining customers’ words with their numbers has synergy. The combination, when well executed, produces a high level of realism that not only informs but educates, not only guides but motivates.

Link Service Performance to Business Results

Intuitively, it makes sense that delivering quality service helps a company at the bottom line. Indeed, accumulating evidence suggests that excellent service enables a firm to strengthen customer loyalty and increase market share.14 However, companies need not rely on outside evidence on this issue. Firms can develop their own evidence of the profit impact of service quality to make the investment more credible and fact-based for the planning and budgeting process.

A service-quality information system should include the impact of service performance on business results. An important benefit of new, declining, and lost-customer surveys is the measurement of market gains and damage linked to service quality. Surveys can reveal the number and percentage of new customers who selected the company for service-related reasons. Declining and lost-customer surveys can determine why customers are buying less or defecting, allowing estimates of revenue lost due to service. Calculating lost revenue because of service dissatisfaction, categorized by specific types of service dissatisfaction, is a dependable way to focus management attention on service improvement. By computing the average costs for reperforming botched services and multiplying them by frequency of occurrence, companies also can calculate the out-of-pocket costs of poor service. Combining lost revenue and out-of-pocket costs attributable to poor service generally will produce a sum far greater than management would assume without formal estimation.

Firms also can directly estimate the profit impact of effective service recovery by measuring complaining customers’ satisfaction with the handling of their complaints and their repurchase intentions. Technical Assistance Research Programs (TARP) has conducted extensive studies documenting the much stronger repurchase intentions of complaining customers who are completely satisfied with the firm’s response compared to dissatisfied customers (complainants and noncomplainants) who remain dissatisfied. Firms can monitor the relationship between service recovery and business results by measuring dissatisfied customers’ propensity to complain (the higher the better because of the opportunity to resolve the complaint), and by measuring complaining customers’ satisfaction with the firm’s response and their repurchase intentions. These data can be used to estimate the return on investment in service recovery, i.e., profits attributed to service recovery divided by the costs of service recovery.15

Another way to gauge the market impact of service quality is to measure customers’ repurchase and other behavioral intentions in transactional and total market surveys. The surveys can ask respondents to rate how likely it is that they will, for example, recommend the firm, do more business with the firm in the next few years, or take some business to a competitor with better prices. Respondents’ intentions can then be regressed against their perceptions of service quality to reveal associations between customers’ service experiences and their future intentions concerning the firm. We have investigated empirically a battery of thirteen behavioral intention statements. Using factor analysis, the thirteen-item battery reconfigured into five dimensions (see Table 2).16

Our research shows strong relationships between service performance and customer loyalty and propensity to switch (see Figure 4). Customers whose service perceptions were below the zone of tolerance were less loyal and more likely to switch to a competitor than customers whose perceptions exceeded the zone. Customers exhibited some willingness to pay more for better service, particularly as service perceptions rose from inadequate to desired. Intentions to complain externally fell slightly across the zone.17 (The internal response dimension is omitted from our analysis because it is based on a single item from the thirteen-item scale.)

Companies that measure customers’ behavioral intentions (or actual behaviors) and monitor their sensitivity to changes in service performance gain valuable information on both why and how to invest in service improvement. Assessing the bottom-line impact of service performance will motivate managerial and non-managerial employees to implement needed changes. It will help a company move from just talking about service to improving service.

Reach Every Employee

A service-quality information system can be beneficial only if decision makers use it. Accordingly, it must be more than a data collection system; it must also be a communications system. Determining who receives what information in what form and when is a principal design challenge. Chase Manhattan Bank vice president John Gregg commented: “I cannot stress enough the need to systematize the use of survey information, a key learning point for us in the last couple of years. It is not just how actionable the data are, but also the system for regularly reviewing the data and making decisions that determine effectiveness.”18

All employees are decision makers as they regularly make decisions that determine the effectiveness of their actions; therefore, a service-quality information system should disseminate relevant service information to everyone in the organization. Front-line service providers, for example, should receive information about the expectations and perceptions of the external or internal customers they serve. These personnel might receive information different from what executives receive — and in different forms (for example, in training classes, newsletters, and videos) — but they should be included in the system. Companies miss an important teaching, reinforcing, culture-building opportunity when they don’t share relevant service information with employees lower in the hierarchy.

John Deere shares customer feedback with every employee. Its system is designed so that employees in different functions receive the information in an appropriate form, e.g., via e-mail, a hard copy of customer comments posted on bulletin boards, and specialized monthly reports. Les Teplicky, manager of after-market support at John Deere, stated: “You need senior management buy-in, good data collection, clear analysis —but all that won’t matter unless every employee sees something in the information for them.”19

Just as in the design of any product, knowing the needs of information users is critical to designing a service-quality information system. The system should revolve around what information different kinds of employees need to help them make good decisions and how and when to communicate the information. (See Table 3 for types of questions to include in both pre-design and postimplementation surveys of targeted information users.) Packaging the right information for each audience and presenting it effectively is key to the success of a service-quality information system. As Peter Drucker stated: “Knowledge is power. In post-capitalism, power comes from transmitting information to make it productive, not hiding it.”20

When listening to customers becomes a habit in a company, when managers find it unthinkable to make service investment decisions unaided by relevant information, when employees eagerly await next month’s service performance scores to gauge progress, when virtually all employees understand the service improvement priorities —then it is clear that the organization is systematically using information to improve service.

Topics

References

1. Quoted in “First Chicago Shelves Paper Surveys, Asks Managers to Use the Telephone for Customer Satisfaction Research,” The Service Edge, volume 8, March 1995, p. 4.

2. E.F. McQuarrie, “Taking a Road Trip,” Marketing Management, volume 3, Spring 1995, p. 11.

3. J.A. Goodman, S.M. Broetzmann, and C. Adamson, “Ineffective — That’s the Problem with Customer Satisfaction Surveys,” Quality Progress, volume 25, May 1992, p. 35.

4. For a detailed discussion of this study, see:

A. Parasuraman, V.A. Zeithaml, and L.L. Berry, “Alternative Scales for Measuring Service Quality: A Comparative Assessment Based on Psychometric and Diagnostic Criteria,” Journal of Retailing, volume 70, Fall 1994, pp. 201–230.

5. See A. Parasuraman, V.A. Zeithaml, and L.L. Berry, “Reassessment of Expectations as a Comparison Standard in Measuring Service Quality: Implications for Further Research,” Journal of Marketing, volume 58, January 1994, pp. 111–124;

J.J. Cronin and S.A. Taylor, “SERVPERF Versus SERVQUAL: Reconciling Performance-Based and Perceptions-Minus-Expectations Measurement of Service Quality,” Journal of Marketing, volume 58, January 1994, pp. 125–131; and

K.R. Teas, “Expectations as a Comparison Standard in Measuring Service Quality: An Assessment of a Reassessment,” Journal of Marketing, volume 58, January 1994, pp. 132–139.

6. B.S. Lunde, “When Being Perfect Is Not Enough,” Marketing Research, volume 5, Winter 1993, p. 26.

7. J.P. Gregg, “Listening to the Voice of the Customer” (Nashville, Tennessee: Frontiers in Services Conference, presentation, October 1995).

8. Quoted in “Changes in Satisfaction Demands and Technology Alter the How’s, What’s, and Why’s of Measurement,” The Service Edge, volume 8, January 1995, p. 2.

9. J.H. Drew and T.R. Fussell, “Becoming Partners with Internal Customers,” Quality Progress, volume 29, October 1996, p. 52.

10. Quoted in “Some Ways to Coddle Customers on a Budget,” The Service Edge, volume 6, September 1993, p. 4.

11. D. Sheff, “Levi’s Changes Everything,” Fast Company, volume 2, June–July 1996, p. 67.

12. McQuarrie (1995), p. 12.

13. L.L. Berry, On Great Service: A Framework for Action (New York: Free Press, 1995), pp. 51–52.

14. See V.A. Zeithaml, L.L. Berry, and A. Parasuraman, “The Behavioral Consequences of Service Quality,” Journal of Marketing, volume 60, April 1996, pp. 31–46; and

R.D. Buzzell and B.T. Gale, The PIMS Principles (New York: Free Press, 1987).

15. See Consumer Complaint Handling in America: An Update Study (Washington, D.C.: Technical Assistance Research Programs Institute, April 1986).

16. Zeithaml et al. (1996).

17. Ibid.

18. Personal correspondence.

19. Quoted in “Rallying the Troops,” On Achieving Excellence, volume 11, February 1996, p. 2.

20. Interview with Peter F. Drucker, Harvard Business Review, volume 71, May–June 1993, p. 120.

Reprint #:

3835

More Like This

Add a comment

You must to post a comment.

First time here? Sign up for a free account: Comment on articles and get access to many more articles.