Using Simulated Experience to Make Sense of Big Data
As data analyses get more complex, how can companies best communicate results to ensure that decision makers have a proper grasp of the data’s implications?
Topics

Many behavioral experiments have shown that when the same statistical information is conveyed in different ways, people make very different decisions.
In an increasingly complex economic and social environment, access to vast amounts of data and information can help organizations and governments make better policies, predictions and decisions. Indeed, more and more decision makers rely on statistical findings and data-based decision models when tackling problems and forming strategies. Scientists, researchers, technologists and journalists have all been monitoring this tendency, trying to understand when and how this approach is most useful and effective.1
So far, discussions have centered mainly on analysis: data collection, technological infrastructures and statistical methods. Yet another vital issue receives far less scrutiny: how analytical results are communicated to decision makers. As the amount of data gets bigger and analyses grow more complex, how can analysts best communicate results to ensure that decision makers have a proper understanding of their implications?
Communicating Statistical Information
However well executed, the usefulness of an analysis depends on how the results are understood by the intended audience. Consider a patient visiting a doctor about an illness. Arguably, the most important task is the diagnosis of the disease, as this can lead to choosing an appropriate treatment. Yet even if the final decision lies with the patient, the chosen treatment may depend on how the doctor communicates different options to the patient. The same is true when an investor consults a financial expert or a manager seeks the services of a consulting firm.
Data science, like medical diagnostics or scientific research, lies in the hands of expert analysts who must explain their findings to executive decision makers who are often less knowledgeable about formal, statistical reasoning. Yet many behavioral experiments have shown that when the same statistical information is conveyed in different ways, people make drastically different decisions.2 Consequently, there is often a large gap between conclusions reached by analysts and what decision makers understand. Here, we address this issue by first identifying strengths and weaknesses of the two most common modes used for communicating results: description and illustration. We then present a third method — simulated experience — that enables intuitive interpretation of statistical information, thereby communicating analytical results even to decision makers who are naïve about statistics.
Description
Description is the default mode of presenting statistical information. This typically involves a verbal statement or a written report, which might feature one or more tables summarizing the findings. The strength of this approach lies in its speed in providing the decision maker with the most essential and salient aspects of a given analysis. But as problems get more complex, this very strength turns into a major flaw. While highlighting one issue, descriptions can end up hiding details that have important decision-making consequences. (See “Describing an Investment Problem.”) The question then becomes: When it comes to making decisions, are we able to differentiate between good and bad descriptions?
Our own research suggests that descriptions can mislead even the most knowledgeable decision makers. In a recent experiment, we asked 257 economics scholars to make judgments and predictions based on a simple regression analysis. (See “About the Research.”) This is the most prevalent type of analysis employed in applied economics in order to identify and quantify a causal relationship between two or more variables. To our surprise, most of these experts had a hard time accurately deciphering and acting on the results of the kind of analysis they themselves frequently conduct. In particular, we found that our description of the findings, which mimicked the industry standard, led to an illusion of predictability — an erroneous belief that the analyzed outcomes were more predictable than they actually were.
The description obscured some sources of uncertainty, and the decision makers became overconfident about their prospects. Ultimately, we managed to avert this illusion by substituting the description with an illustration. This time, judgments and decisions were accurate, suggesting that the description of the results was indeed to blame for the misperceptions.3
Illustration
Illustrations in the form of a graph, figure, diagram or chart are also used regularly to communicate statistical information. Unlike description, the primary objective is to give an overview of the analysis and provide a bigger (albeit less precise) picture about the findings. Consequently, decision makers are better able to acknowledge the trends, effects and risks of their prospective decisions.4 Using illustrations, it is more difficult for crucial parts of the results to remain hidden. Hence, one benefit of visualizing data is in making uncertainties more transparent. (See “Illustrating an Investment Problem.”) In fact, a 2011 Science article that evaluates human proficiency in visualizing data is aptly entitled “Visualizing Uncertainty About the Future.”5
Illustrating an Investment Problem
Consider the investment problem described in the previous exhibit. Here is the illustration of the X-Y relationship based on 250 individual observations, on which the analysis is conducted:
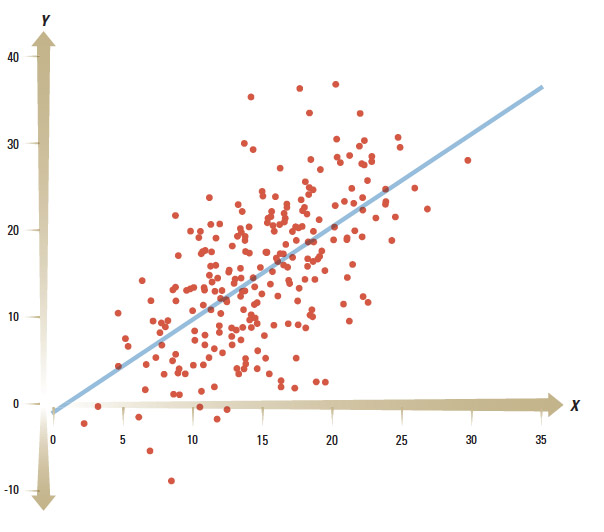
Seeing a graph of the past investments instead of a description that summarizes them helps a decision maker acknowledge the uncertainties inherent in the outcomes. The description featured previously only mentions the fitted line and disregards completely the cloud of data that surrounds it. Now it becomes clear that despite a 1-to-1 average effect, someone with a positive investment might end up with a negative outcome (see the data points below the horizontal line). Moreover, a larger investment would not always guarantee a larger return than that of someone who made a smaller investment.
Illustrating the relationship between two variables is easy. What if, however, there were multiple investment options instead of just the one? This is almost always the case in real-life analyses and situations. Illustrating many interrelated variables in one figure is unwieldy, if not unfeasible. In the face of such complexities, illustrations are bound to be less meaningful.
Yet for all of its benefits, illustration is not always an ideal way to communicate complexities. The more variables, structural changes, connections and patterns there are in the data, the harder it becomes to condense them into one display. Moreover, like description, illustration is typically static and not interactive. Hans Rosling, a professor of international health at Karolinska Institute in Solna, Sweden, has attempted to counteract these shortcomings with the aid of visual technology. Specifically, he creates innovative visualizations of trends in global development using dynamic graphs that show changes across time.6 In a similar fashion, Betterment LLC, an investing service based in New York, has recently created a tool that lets users visualize the evolution of an investment of $100 in the S&P 500 over a given holding period.7
Nonetheless, the shortcomings of description and illustration remain a pervasive problem. Projecting a multifaceted, convoluted and complicated process into static words, tables and graphs inexorably means omitting crucial parts of the results. Relevant information is inevitably lost in translation. Would it be possible, therefore, to develop a dynamic alternative to these available approaches — one that would let decision makers more readily grasp the complexities and uncertainties inherent in the analyses?
In a series of studies, we designed and tested the effectiveness of an alternate method of communication. Instead of describing or illustrating the analysis, we let decision makers gain experience on the outcomes of different possible actions by interacting with simulations based on the same analysis. Our findings showed that regardless of their level of statistical sophistication, people relate well to such an approach. Moreover, as analyses become more complicated, decision makers tend to trust experience more than their analytical intuitions. Most importantly, their judgments and decisions improve in the face of increasing uncertainty and complexity. We call this approach simulated experience.8
Simulated Experience
For tens of thousands of years, humans formed judgments and made decisions exclusively through experience. Formal statistical reasoning and tools are comparatively recent innovations. In particular, probability theory, which constitutes the foundation of our current methods of analysis, was only conceived in the 17th century.9 The problem we face today is that our ability to communicate and understand statistical outcomes has not advanced as rapidly as our proficiency in handling data. In fact, all nonhuman animals still depend solely on experience to make choices and solve their problems. In which locations are sources of food available — and with what regularity? Where are predators present? Which meteorological patterns and trends exist in a particular environment? These are vital issues for survival. It is therefore unsurprising that evolution has endowed both animals and humans with remarkable capacities to encode information about past occurrences.10 When it comes to understanding and communicating statistical information, experience is a powerful yet often underappreciated tool.
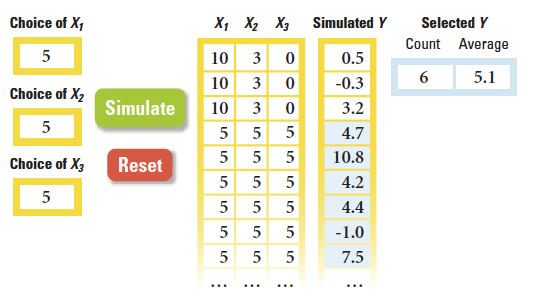
Understanding an Investment Problem Through Simulated Experience
 View Exhibit
This time, consider a slightly more complex investment problem, where there are three possible investment options (X1, X2 and X3) affecting the outcome Y, instead of just one. The interface below lets decision makers enter their choices of X1, X2 and X3. When a user clicks the simulate button, the model simulates a corresponding Y based on the analysis conducted on the available data. Users are free to enter as many input sets and simulate as many outputs for each as they wish.
The simulation presented here records the previous entries and outcomes. This allows users to select a subsample of outcomes (the highlighted part of the “simulated Y“ column) and obtain the average of that selected subsample. (The reset button clears all previously simulated data.) Hence, users not only gain insights by making decisions and experiencing the consequences, but they also can gather information about the average effects of their strategies. One could also construct a histogram based on the selected subsample — an illustration of the frequencies of simulated outputs — to visually display how potential outcomes are distributed.

Simulated experience exploits our natural ability to transform complicated information into actionable knowledge. Essentially, it lets the decision maker live through the problem many times with the aid of a simulation. (See “Understanding an Investment Problem Through Simulated Experience.”) The implementation of simulated experience involves four components:
Analysis Conduct an analysis using available data, from which an analyst might normally craft a description or illustration.
Simulation Instead of creating some type of description or illustration, the analyst constructs a simulation model based on the findings of the analysis.
Interaction Executive decision makers interact with the simulation model and can input potential actions and observe the subsequent outcomes.
Experience Decision makers can experiment with changing their inputs. That way, they can experience as many outcomes as they wish, given those inputs. Executives gain experiential evidence about potential consequences of their actions, based on the statistical analysis.
Research attests to the effectiveness of this approach when the problem is both hard to handle and rife with uncertainties. For example, one article in the Journal of Consumer Research found that individuals create better retirement plans when they interactively observe their potential future benefits.11 Researchers at the University of Zurich have found that simulated experience helps investors perceive accurately the underlying risk-return profile of their investments.12 A recent Management Science article suggests that banks could employ such a communication method to help their clients accurately perceive the risks associated with different investment products.13 John Sterman, the Jay W. Forrester Professor of Management at the MIT Sloan School of Management and director of MIT’s System Dynamics Group, argues that climate change debates involve crucial misperceptions — and he effectively removes them by simulating viable scenarios.14
In our own research, we find that people have difficulty assessing their chances of success in competitions and market-entry decisions, but simulating such situations leads to improved assessments and decisions.15 Moreover, simulated experience has demonstrably helped to correct judgmental biases, such as neglecting base rates in probabilistic statements.16 Accordingly, initiatives such as Probability Management Inc. — a nonprofit organization that aims at improving communication of uncertainty through open-source decision-support tools — seek to put such evidence to use, applying simulation-based communication to improve actual managerial decisions and public policies.17 (See “Designing Simulations.”)
There are several software packages that provide the necessary tools to create a wide range of simulations for diverse decision-making situations. Oracle Crystal Ball, Frontline Systems’ Risk Solver Platform and Lumina’s Analytica are among the most prominent. With a little bit of knowledge in programming, one could also create simulations from scratch using platforms such as MATLAB or C++. Of course, Microsoft’s Excel is always handy if the decision problem is relatively simple.
Simulated experiences are not without their weaknesses and blind spots. For instance, if decision makers simulate only a small set of experiences, the resulting intuitions might be driven by sampling variability. The remedy is to generate a large number of observations, given the same input, before forming an idea about the uncertainties. Finally, like all other communication methods, simulated experience is useful as long as the underlying analysis is unbiased and accurate. If the analysis has blind spots, so will the descriptions, illustrations and simulated experiences that stem from it.
Precisely Wrong Versus Approximately Correct
Advances in computing technology allow us to build simulations for virtually any scenario. However, this does not mean that we should employ this method for all problems. For simple probabilistic situations, a description or illustration may be a wiser choice. But as complexity grows and uncertainties arise, simulations can help managers better understand statistical information and thus enable them to make better decisions, regardless of their levels of statistical expertise. We do not call for the abandonment of descriptions or illustrations. Instead, we argue that these should sometimes be augmented with add-on simulations.
Why is it, then, that we rarely encounter simulations for critical decisions about medical treatments, investment options, pension plans, insurance programs and so on? After all, simulation technology is not new. In fact, it has always been essential to any engineering process. The issue is that simulations are still primarily seen as sophisticated tools for statistical analysis — as opposed to a means for communicating results.
There are two main reasons for this. The first is technical: There is a cost to building simulations. So it is easier for analysts to only craft descriptions or build illustrations using the features in statistics software. Second, and more importantly, simulations are vague. An interface that lets you provide your inputs, simulate the analysis, and sequentially observe the related outcomes does not steer you toward a precise answer. You have to make up your own mind as you experience the simulated outcomes. We typically do not appreciate such a fuzzy approach, especially if the decision is important. We seek perfect solutions — exact maneuvers that will lead to desired outcomes. As managers, politicians and individual decision makers, we prefer learning correct answers right away.
However, the very presence of uncertainty suggests it’s wise to refrain from seeking fast solutions. No decision has a completely foreseeable set of outcomes. In both business and life, chance has its say. Leaning too heavily on likelihoods will inevitably lead to the belief that we can predict outcomes more accurately than we can. Such misperceptions can lead to precise but wrong answers to important questions.
Simulated experience aims to counter this tendency by letting decision makers feel the most likely answers. In the words of a famous American mathematician, the late John W. Tukey, “Far better an approximate answer to the right question, which is often vague, than an exact answer to the wrong question, which can always be made precise.”
References
1. P. Simon, “Too Big to Ignore: The Business Case for Big Data” (Hoboken, New Jersey: John Wiley & Sons, 2013) offers an overview of business applications of data science. See also R. Fildes and P. Goodwin, “Against Your Better Judgment? How Organizations Can Improve Their Use of Management Judgment in Forecasting,” Interfaces 37, no. 6 (November-December 2007): 570-576.
2. A. Tversky and D. Kahneman, “The Framing of Decisions and the Psychology of Choice,” Science 211, no. 4481 (January 30, 1981): 453-458; A. Tversky, P. Slovic and D. Kahneman, “The Causes of Preference Reversal,” American Economic Review 80, no. 1 (March 1990): 204-217; C.K. Hsee, G.F. Loewenstein, S. Blount and M.H. Bazerman, “Preference Reversals Between Joint and Separate Evaluations of Options: A Review and Theoretical Analysis,” Psychological Bulletin 125, no. 5 (September 1999): 576-590; A. Tversky and R.H. Thaler, “Anomalies: Preference Reversals,” Journal of Economic Perspectives 4, no. 2 (spring 1990): 201-211; and for a specific case study, see J. Koehler, “Psychology of Numbers in the Courtroom: How to Make DNA-Match Statistics Seem Impressive or Insufficient,” Southern California Law Review 74 (2001): 1275-1306.
3. E. Soyer and R.M. Hogarth, “The Illusion of Predictability: How Regression Statistics Mislead Experts,” International Journal of Forecasting 28, no. 3 (July-September 2012): 695-711.
4. R.M. Hogarth and E. Soyer, “A Picture’s Worth a Thousand Numbers,” Harvard Business Review 91, no. 6 (June 2013): 26.
5. D. Spiegelhalter, M. Pearson and I. Short, “Visualizing Uncertainty About the Future,” Science 333, no. 6048 (September 9, 2011): 1393-1400.
6. H. Rosling, “The Best Stats You’ve Ever Seen,” TED talk filmed February 2006, www.ted.com.
7. An interface shows the relationship between time and returns based on daily data. See: D. Egan, “It’s About Time in the Market, Not Market Timing.” October 14, 2014, www.betterment.com.
8. R.M. Hogarth and E. Soyer, “Sequentially Simulated Outcomes: Kind Experience Versus Nontransparent Description,” Journal of Experimental Psychology: General 140, no. 3 (August 2011): 434-463; R.M. Hogarth and E. Soyer, “Providing Information for Decision Making: Contrasting Description and Simulation,” Journal of Applied Research in Memory and Cognition, in press, published online January 29, 2014; R.M. Hogarth and E. Soyer, “Communicating Forecasts: The Simplicity of Simulated Experience,” Journal of Business Research, in press.
9. G. Shafer, “The Early Development of Mathematical Probability,” in “Companion Encyclopedia of the History and Philosophy of the Mathematical Sciences, Volume 2” ed. I. Grattan-Guinness (London and New York: Routledge, 1993): 1293-1302.
10. L. Hasher and R.T. Zacks, “Automatic and Effortful Processes in Memory,” Journal of Experimental Psychology: General 108, no. 3 (September 1979): 356-388; L. Hasher and R.T. Zacks, “Automatic Processing of Fundamental Information: The Case of Frequency of Occurrence,” American Psychologist 39, no. 12 (December 1984): 1372-1388; P. Sedlmeier and T. Betsch, “Etc. Frequency Processing and Cognition” (New York: Oxford University Press, 2002).
11. D.G. Goldstein, E.J. Johnson and W.F. Sharpe, “Choosing Outcomes Versus Choosing Products: Consumer- Focused Retirement Investment Advice,” Journal of Consumer Research 35, no. 3 (October 2008): 440-456.
12. M.A. Bradbury, T. Hens and S. Zeisberger, “Improving Investment Decisions With Simulated Experience,” Review of Finance, published online June 6, 2014.
13. C. Kaufmann, M. Weber and E. Haisley, “The Role of Experience Sampling and Graphical Displays on One’s Investment Risk Appetite,” Management Science 59, no.2 (February 2013): 323-340.
14. J.D. Sterman, “Communicating Climate Change Risks in a Skeptical World,” Climatic Change 108, no. 4 (October 2011): 811-826.
15. R.M. Hogarth, K. Mukherjee and E. Soyer, “Assessing the Chances of Success: Naïve Statistics Versus Kind Experience,” Journal of Experimental Psychology: Learning, Memory, and Cognition 39, no. 1 (January 2013): 14-32.
16. B.K. Hayes, B.R. Newell and G.E. Hawkins. “Causal Model and Sampling Approaches to Reducing Base Rate Neglect,” in “Proceedings of the 35th Annual Conference of the Cognitive Science Society,” eds. M. Knauff, M. Pauen, N. Sebanz and I. Wachsmuth (Austin, Texas: Cognitive Science Society, 2013.)
17. Probability Management is an organization that aims to improve communication of uncertainty through open-source decision support tools. More information can be found at www.probabilitymanagement.org.